Click to watch the video: Master Chen's 3.26 Video: Is the Market Bearish Harmonic Pattern? DOGE Medium-term Analysis
So, Bitcoin also experienced a significant surge last night. From a technical indicator perspective, it seems that Bitcoin has two harmonic patterns in the short term. Many friends who were shorting Bitcoin found themselves either trapped or liquidated.
My view is that it's best not to short in a bull market. If you must short, focus on ultra-short term positions. In today's video, we will discuss the two harmonic patterns of Bitcoin and the recent short-term trend of Dogecoin.

First, let's look at the daily chart of Bitcoin. This time, Bitcoin dropped from the high of 73,000 to its current position, around 71,000. I feel there is a bearish harmonic pattern. Whether it's a bearish Gartley or a bat pattern is hard to predict, so we should focus on the space.
For example, the high point of the surge, around $48,000, also has a bearish harmonic pattern, or a bearish butterfly pattern, followed by a short-term decline.
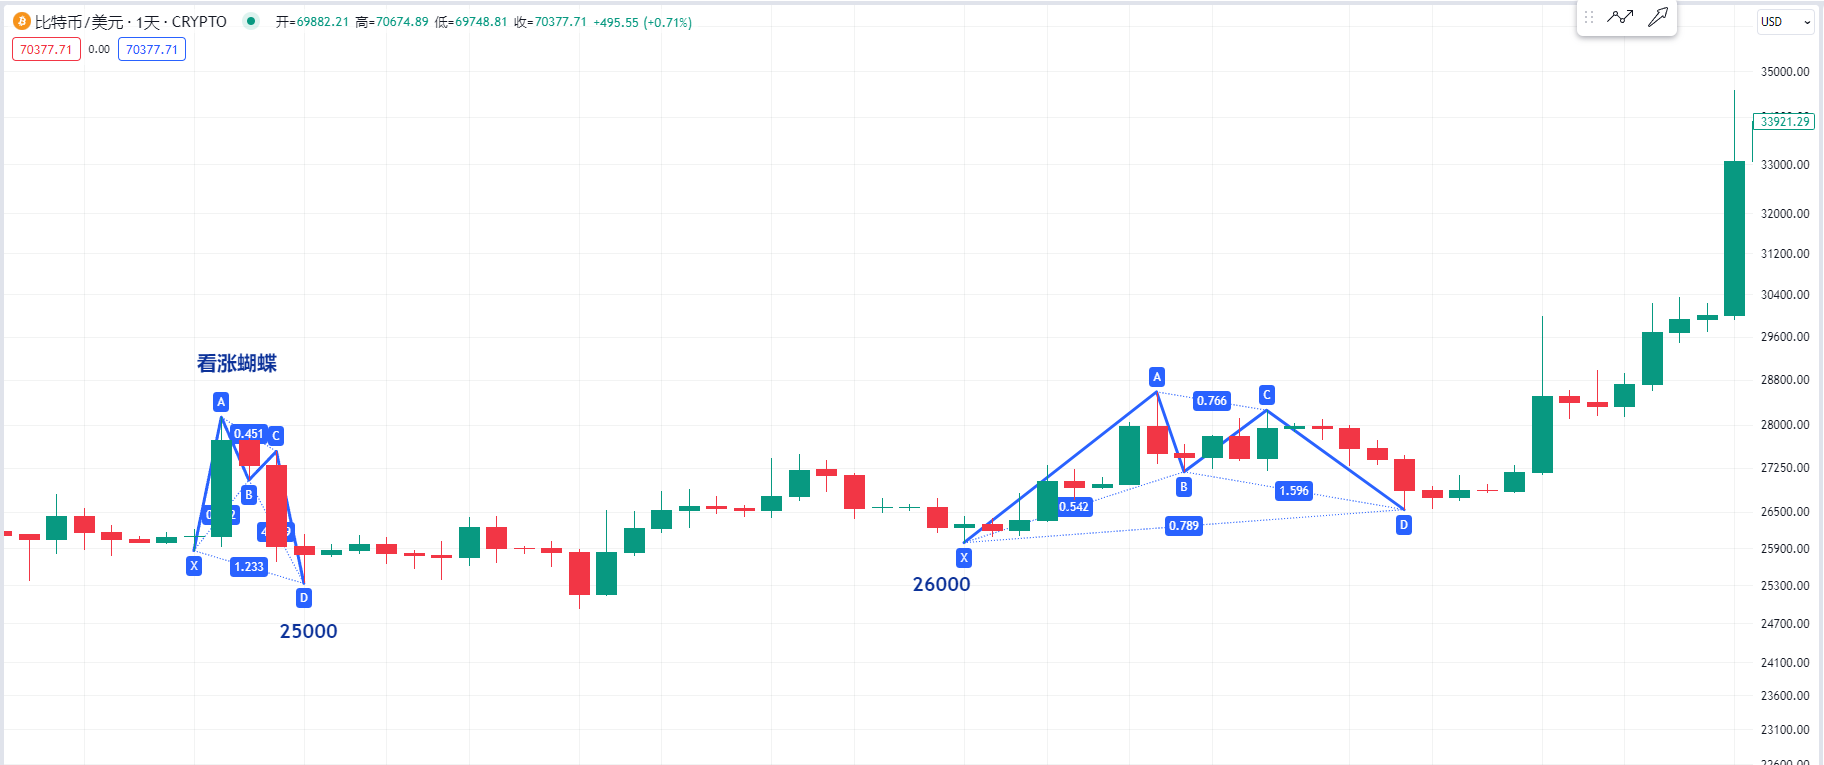
We can also look back to when Bitcoin dropped from 32,000 to the low of 25,000. At that time, I firmly believed in going long, and there was a bullish butterfly pattern at that position. I also mentioned a very clear bullish Gartley pattern at that time. So, I have always been bullish on Bitcoin in the past couple of years. When encountering such bullish harmonic patterns, we must hold onto the medium to long-term profits and not ignore the substantial long-term gains due to short-term fluctuations.
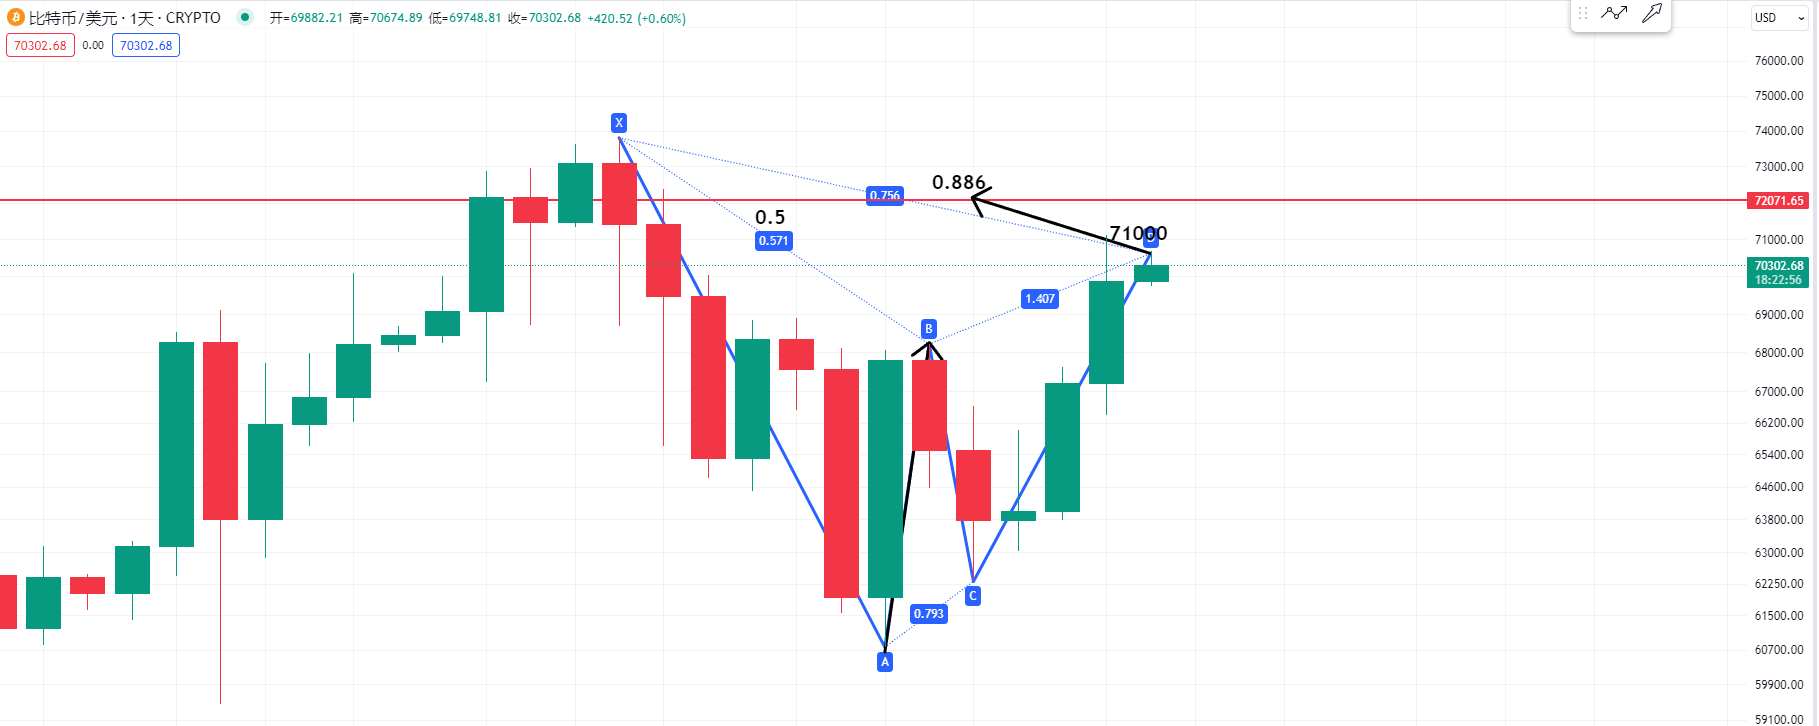
Now let's look at the current trend of Bitcoin. Is this harmonic pattern possibly a bearish Gartley? We can observe the position from point X to point A. The subsequent rise to point B is not very standard. If it were a standard Gartley, the rebound at point B should be close to 0.571, or we can observe the position of the drop from point B to point C, which is very close to 0.886. Then the high point hit yesterday is very close to 0.786, slightly exceeding it.
I am observing whether this is a bearish Gartley or possibly a bearish bat pattern, as the bat pattern is also very close. The position of point B in the bat pattern generally should not exceed 0.5, but this position slightly exceeds it.
Or if this position is a bearish bat pattern, we should pay attention to whether point D could come to the 0.886 position, which is close to around 720,000. This position could be a resistance zone. Of course, it's also possible that this pattern has not yet emerged.

We can observe the structure at the 4-hour level. Yesterday, it rose to around 71,000, and there was a bearish candle. I believe that if this harmonic pattern is to be resolved, this bearish candle must be broken through within the short term, at least up to 71,000. The level above, 72,000, must also be broken through in the short term. If the pattern forms, we should observe that it cannot fall below 69,000 in the short term. This is an important support level that I mentioned in today's updated market analysis article. If Bitcoin can continue to consolidate at its current position, it will continue to rise. So, personally, I remain bullish in the long term, but caution is advised in the short term at this position.
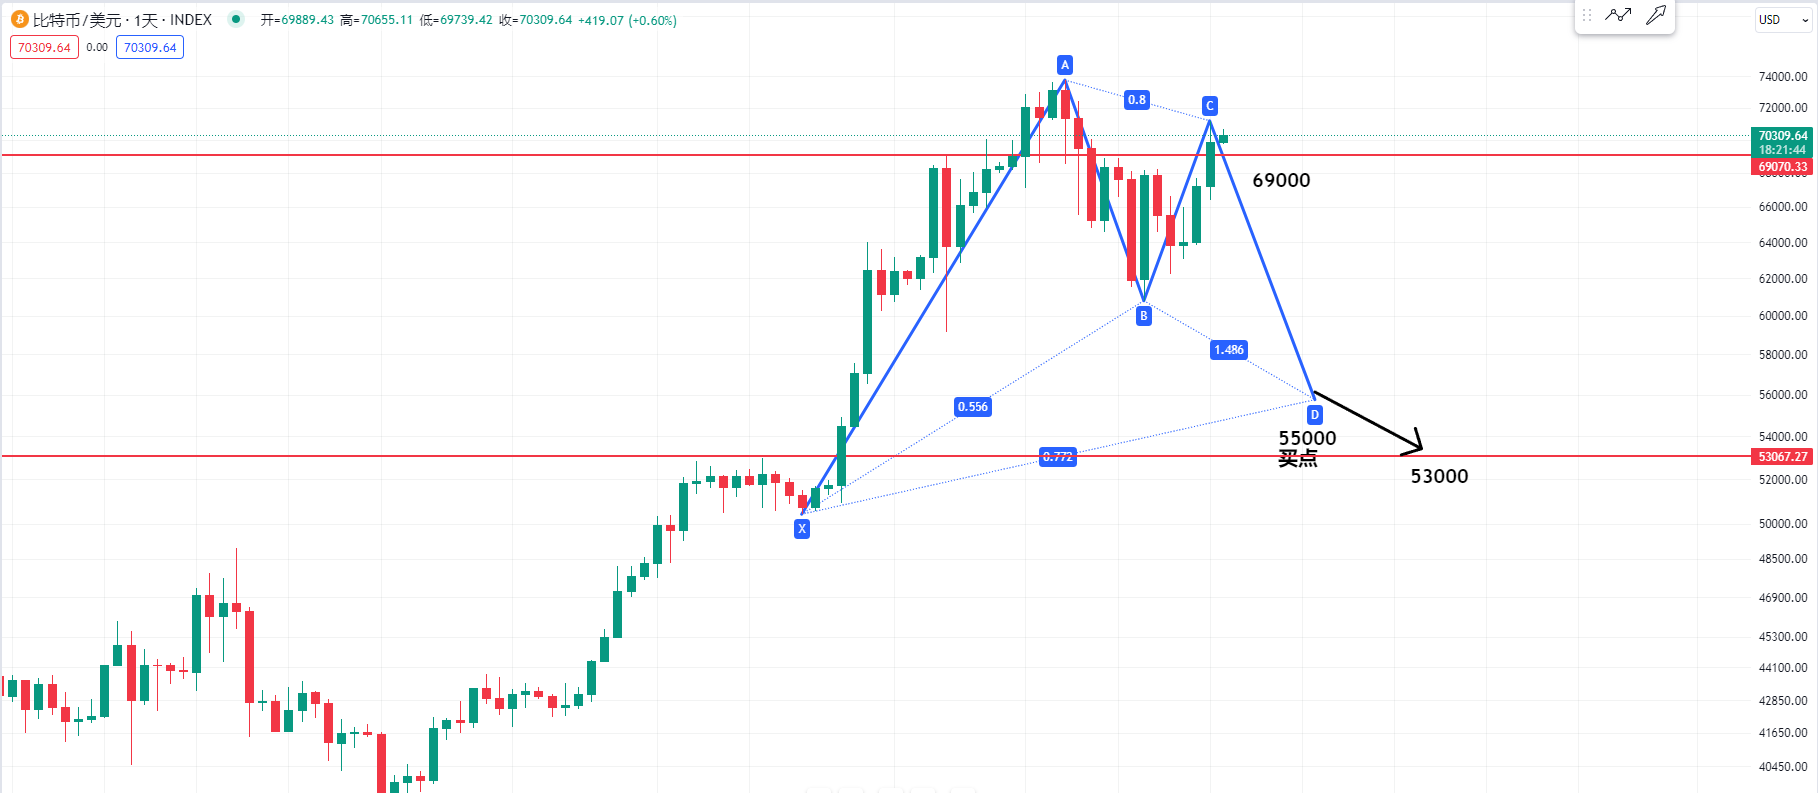
Next, let's look at the daily chart of Bitcoin again. At the current high point, some fans are asking if this position might be a head and shoulders pattern because yesterday's candle left an upper shadow. It's best to break through in the short term.
Or we can observe the pattern. It has not formed yet. If we look at the low point from point X to point A, the retracement low point is very close to 0.618, or the position of point C is very close to 0.886. I still consider 69,000 to be a very important support at the moment. We need to observe that this level is not broken. We also need to be cautious in case it is broken. If the entire long-term trend turns out to be a bullish harmonic pattern, and if this pattern is a Gartley because the position of point B has not reached 0.618, or it can also be seen as a bullish Gartley at the 0.786 position, we can observe whether the buy point at point D will be around 55,000. Of course, this pattern has not yet formed. Or if it is not a bullish Gartley, and if it falls from the current position, we need to be cautious that 69,000 is not broken. If it comes down, and if point D is a bullish bat pattern, we need to pay attention to the 0.886 position at around 53,000. So, we need to observe whether the buy point at point D will be around 55,000 if it is a bullish Gartley.

Now let's look at the daily chart of Dogecoin. Bitcoin rose yesterday, but Dogecoin surged to a high and then fell back. This is mainly due to the pressure at the top of this large range. Yesterday's upper shadow is close to the top of the range. For futures trading, I suggest not going long because after returning to this range, we need to observe whether the middle half of the range could be a very important support, around 0.165. I believe there is a possibility of consolidation around the middle of the range. The upper area is also a strong zone. After consolidation, is there a possibility of breaking through the upper boundary of the range? I also mentioned not going long on Dogecoin near 0.2, or we can observe that yesterday's upper shadow was close to the upper band of the Bollinger Bands. We should try to avoid going long. The lower band of the Bollinger Bands at the daily level could be support, and the upper band could be short-term resistance. The middle band of the Bollinger Bands is also close to the middle of Dogecoin's range. It is currently in a strong area. As long as Bitcoin remains stable, Dogecoin will continue to consolidate and then break through to challenge 0.2, and maybe even reach $1 this year.
For more strategies, you can join the live trading.
Candlesticks are king, trends are emperor. I am Master Chen, focusing on BTC and ETH spot and contract trading for many years. There is no 100% method, only 100% following the trend. I update macro analysis articles and technical analysis review videos daily across the web. Friendly reminder: Only the official public account (shown in the image above) is written by Master Chen. The advertisements at the end of the article and in the comments are not related to me. Please be cautious in distinguishing between true and false. Thank you for reading.
免责声明:本文章仅代表作者个人观点,不代表本平台的立场和观点。本文章仅供信息分享,不构成对任何人的任何投资建议。用户与作者之间的任何争议,与本平台无关。如网页中刊载的文章或图片涉及侵权,请提供相关的权利证明和身份证明发送邮件到support@aicoin.com,本平台相关工作人员将会进行核查。


