周末两天币圈走势以反弹为主,符合上周大饼和以太4小时级别三买预期,大饼已经反弹至67000点,以太反弹至3450。
周六早上7点多大饼震荡回调到63000点时,本号在社区明确提示4小时级别向上一段右侧即30分钟二买上车机会,当下已经完美兑现。
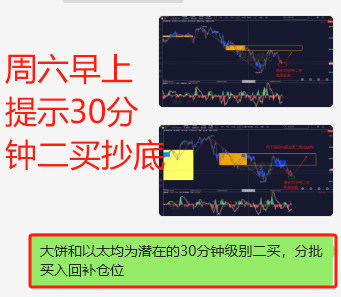
从反弹的力度看,由于是周末量能不算太大,但是30分钟二买的出现基本扭转了前几天的下跌趋势。就在市场最恐慌的时候,本社区第一次在61000附近提示抄底,第二次就是周六早上提示。又一次禅阐释缠论买卖点定理:买点总在恐慌下跌中出现,卖点总在疯狂上涨时产生!正确的操作节奏是下跌的时候寻找买点上车,上涨的时候出现卖点减仓,对受人性弱点:恐惧和贪婪情绪控制的大部分市场参与者来说,操作节奏往往是相反的,追涨杀跌成为常态,这也是交易市场二八法则的根本原因。
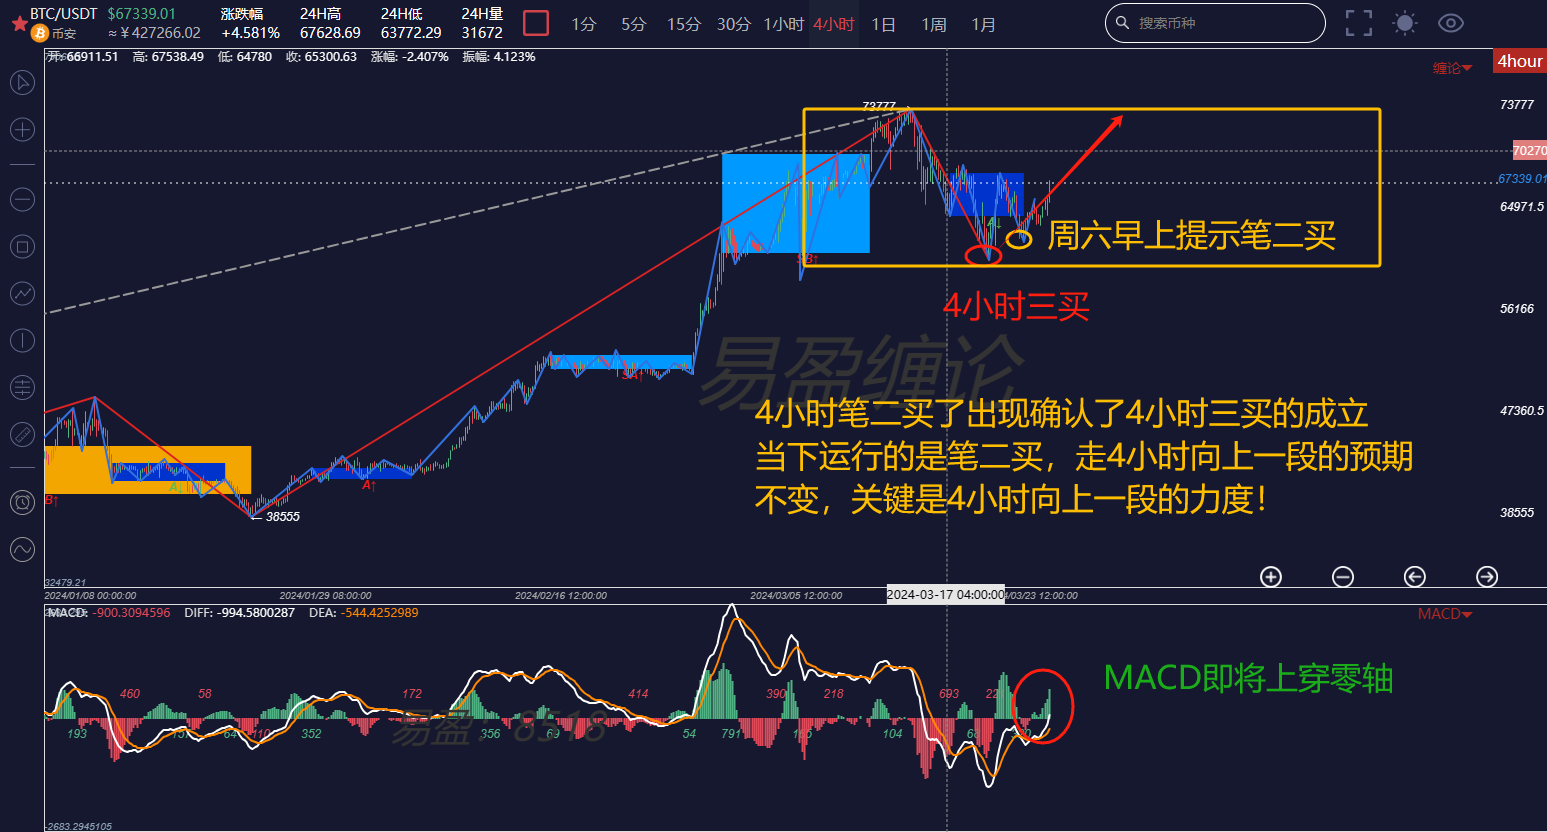
回到当下行情,4小时级别三买在出现笔二买之后基本被确认。MACD即将上穿零轴,说明短期内多头重新占据优势。站在4小时级别来说,三买之后向上突破的力度显得尤为重要,本号认为大概率走势还是会向上突破73777高点再次构造多头陷阱,之后再来一波反杀。重新走4小时向下一段回调,甚至会生长为日线级别向下一段回调,值得引起高度注意!
因此未来中短线抄底的仓位在出现次级别卖点的时候需要及时分批减仓,虽然无法准确预测突破之后会延伸到哪里,但是越涨越卖才是正确的节奏。当然这里减仓指的是中短线仓位,长线低成本仓位可以无视。
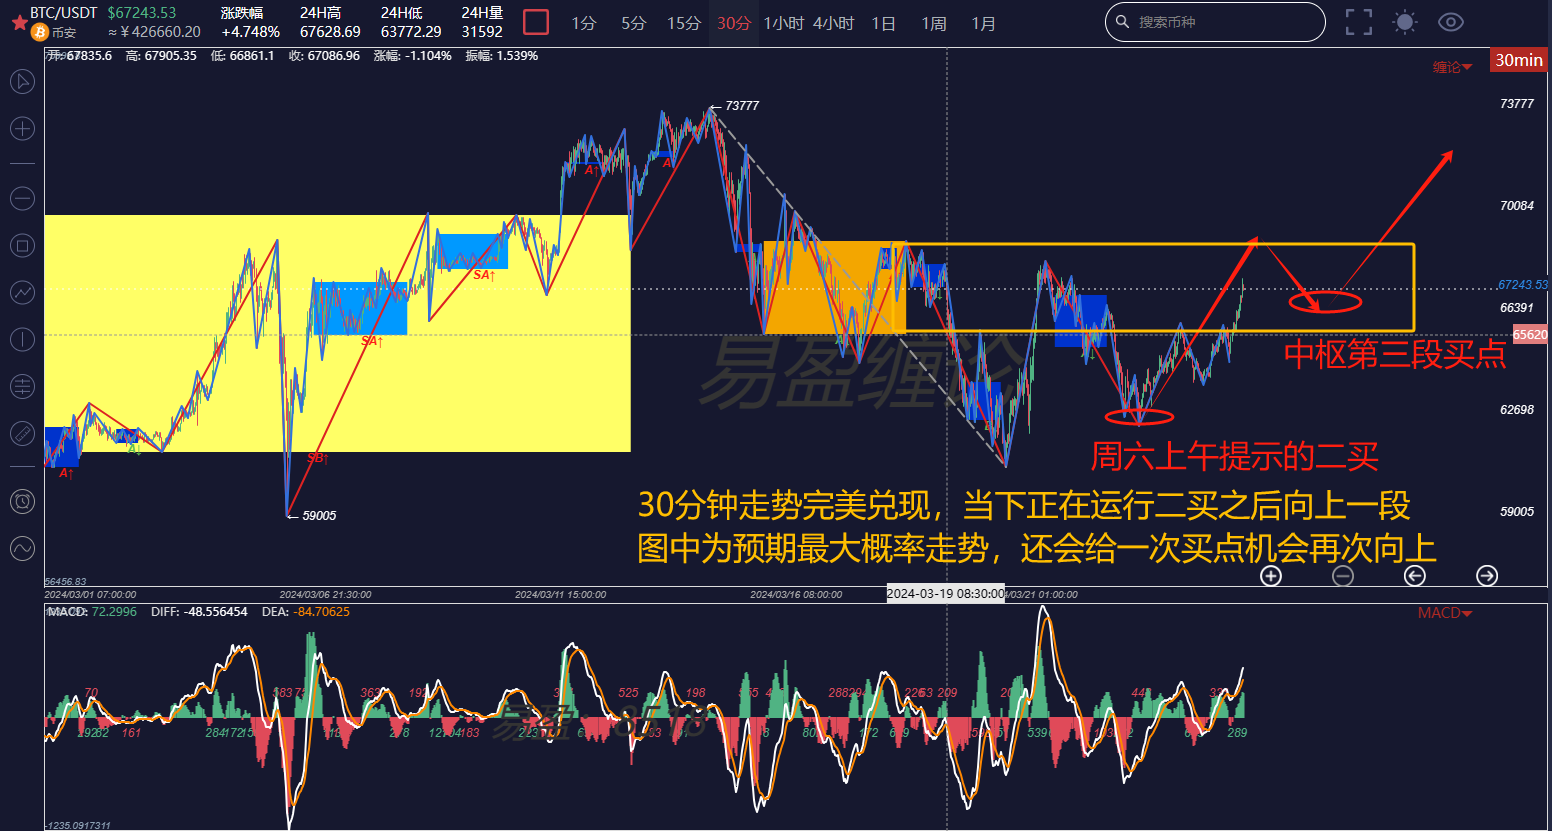
再看短线30分钟图,当下运行的是30分钟二买向上一段,反弹到上一波反弹高点68240之前还是受到了一定阻力。图中给出大概率走势,二买向上一段终结之后还会继续震荡走向下回调一段,再次出现中枢第三段买点就会向上突破。
朋友们如果对缠论感兴趣,想免费获取缠论学习资料,收看公开直播,参加缠论线下训练营,学习缠论精进自己交易技术,构建自己交易体系达到稳定盈利目标,利用缠论技术及时逃顶和抄底。可以扫码关注以下公众号私聊获取和添加本号微信进群学习!

免责声明:本文章仅代表作者个人观点,不代表本平台的立场和观点。本文章仅供信息分享,不构成对任何人的任何投资建议。用户与作者之间的任何争议,与本平台无关。如网页中刊载的文章或图片涉及侵权,请提供相关的权利证明和身份证明发送邮件到support@aicoin.com,本平台相关工作人员将会进行核查。


