Click to watch the video: Master Chen 3.7 Video: Interpretation of Consolidation and Retracement Risks, Next Buying Point for the Market and Dogecoin?
Today in the video, we will discuss the next buying point for Bitcoin or Dogecoin. Many friends still hold a majority of Bitcoin long positions or Dogecoin long positions. However, there may be consolidation or retracement risks for Bitcoin recently. I will also share some short-term and medium-term knowledge with everyone later.
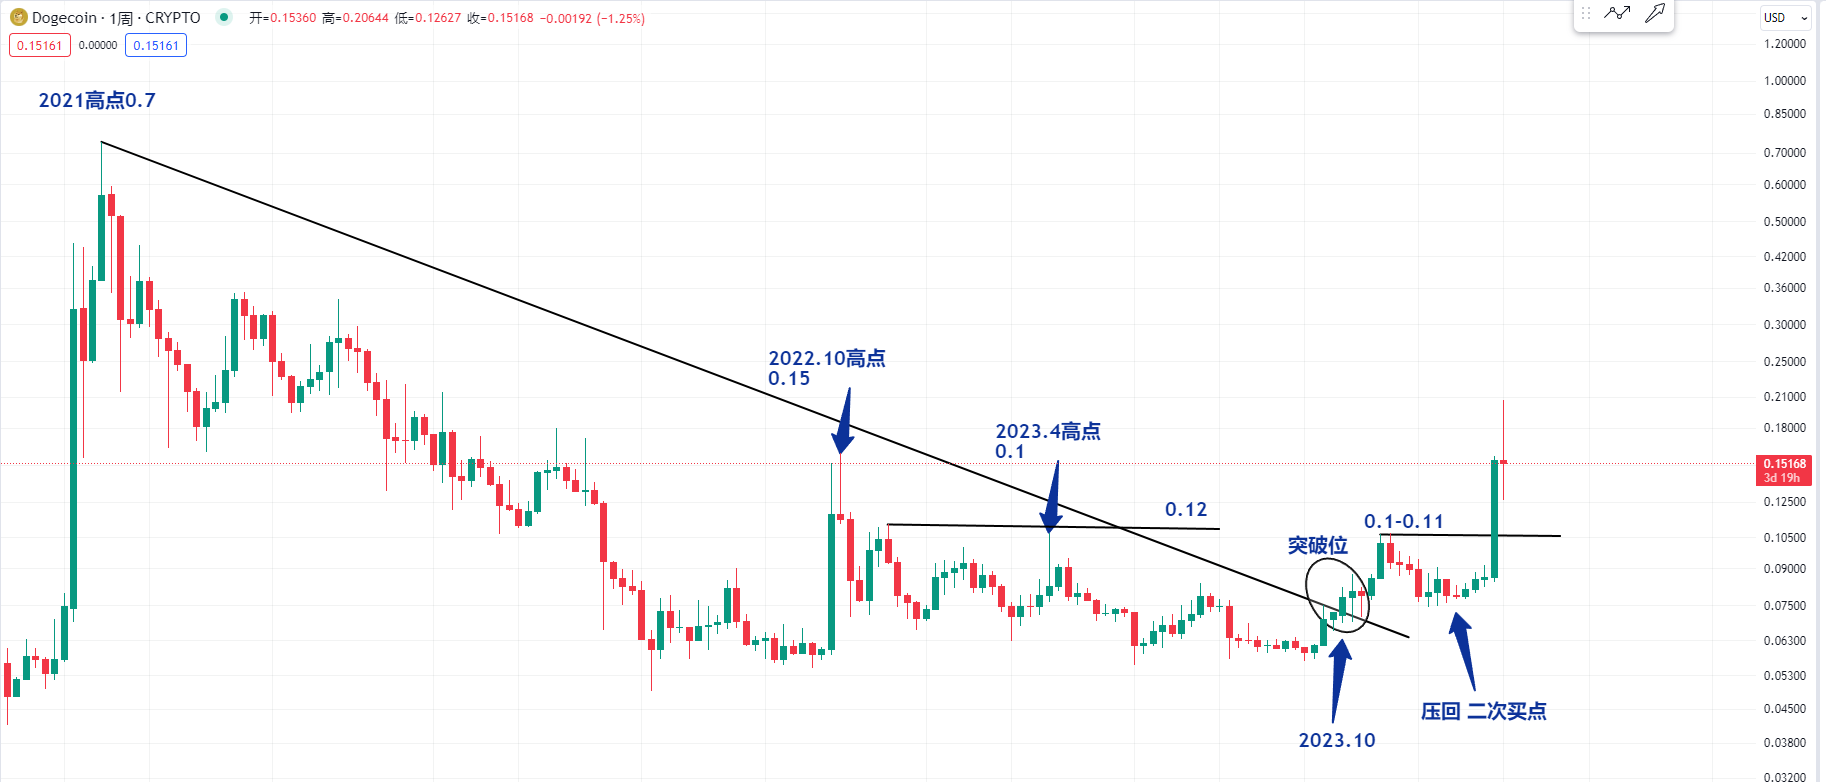
First, let's take a look at the weekly chart of Dogecoin. Dogecoin broke a downtrend line that lasted for more than two years starting from October 2023. For example, it broke the high point in 2021 at 0.7, the high point in October 2022, and the high point in April 2023. There was a downtrend line lasting for more than two years. According to technical analysis theory, there are several potential buying points.
If the downtrend line in a bear market is broken, the breaking point may be a very important buying point, and it's not advisable to be bearish in the long term thereafter. Similarly, for Bitcoin, which has been more than two years, I have been emphasizing not to be bearish in the long term on Bitcoin, and the breaking point is also a buying point. The potential retracement point may also be a very important second buying point.
 Then let's take a look at Dogecoin's position in 2020. It also had a very important downtrend line lasting for more than two years. For example, the high point in January 2018, the high point in February 2020, and the high point in June 2021 were all very important high points that formed a downtrend line lasting for more than two years.
Another point to remember is that the longer the downtrend line is broken, the stronger the momentum will be. Therefore, the position in 2020 is also a very important buying point. We should also be cautious if there is a retracement.
So, from the observation of the two historical patterns of Dogecoin's weekly chart, it feels like the same main force is operating here. When it breaks through and retraces, it can also be a buying point. The recent large fluctuations may be observed because the manipulators at the bottom are operating in this way. The amount it rises may be the amount it falls.
Next, let's observe the current uptrend candle of Dogecoin. If the price rises too much, it may consolidate, or as I mentioned before, there may be support around 0.1 to 0.11. It has not retraced to this support level yet, and I believe it may not retrace to this support level. Another important support level is around 0.12.
So, my current view is that since it is judged that Bitcoin may be consolidating, we should observe Dogecoin as much as possible. If it consolidates at the current position, the retracement can also be considered as consolidation. Therefore, for the contract trading of Dogecoin, everyone needs to be careful because the fluctuations caused by the manipulators of Dogecoin are very large, and a 30% or 40% increase or decrease may be considered a consolidation range. Therefore, if you want to trade Dogecoin contracts, you must pay attention to the risks.
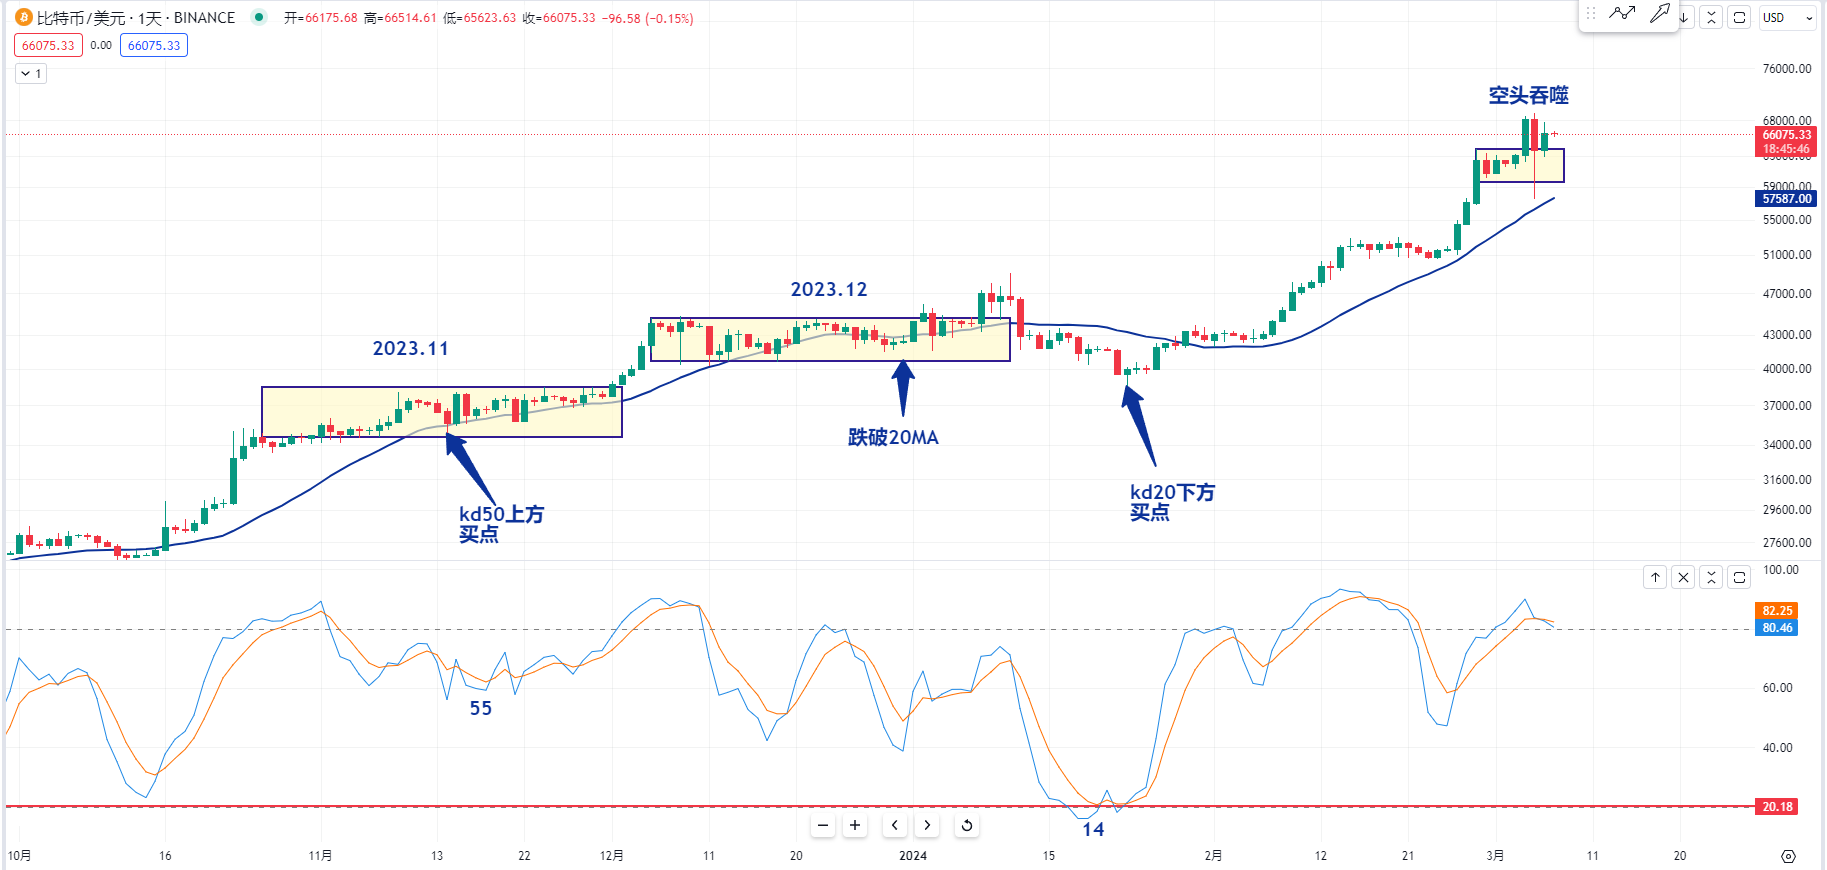 Next, let's take a look at the daily chart of Bitcoin. Why are we worried that Bitcoin may consolidate at this position without retracement? Because we can see that many technical indicators can be understood. In the past two days, these two uptrend candles have turned into bearish engulfing patterns.
If there is a consolidation structure at this position, we need to refer to the fact that every time Bitcoin's price rises, it will have similar consolidation ranges after the uptrend. We need to pay attention to the blue 20-day moving average during the consolidation, as it is also the lifeline of retail investors. This time, we should pay attention to whether it can stay above the 20-day moving average if there is a consolidation structure.
If it falls below the 20-day moving average during the consolidation process, as in the range in November 2023, when it did not fall below the 20-day moving average, there will be a very important buying point near the 50 level of the KD indicator below. If it falls below the 20-day moving average in the range in December 2023, the buying point position of the KD indicator may be below 20. Therefore, if it is still consolidating at this position recently, we need to be a little more cautious. If the price really falls below the 20-day moving average, then we need to observe where Bitcoin will have a support buying point.
For more strategies, you can join the live trading.
K-line is king, trend is emperor. I am Master Chen, focusing on BTC, ETH spot and contract trading for many years. There is no 100% method, only 100% trend following. I update macro analysis articles and technical analysis review videos daily across the web.
 Friendly reminder: This article is only written by Master Chen on the official public account (as shown in the picture above). The advertisements at the end of the article and in the comments section are not related to the author. Please be cautious in distinguishing between true and false. Thank you for reading.
免责声明:本文章仅代表作者个人观点,不代表本平台的立场和观点。本文章仅供信息分享,不构成对任何人的任何投资建议。用户与作者之间的任何争议,与本平台无关。如网页中刊载的文章或图片涉及侵权,请提供相关的权利证明和身份证明发送邮件到support@aicoin.com,本平台相关工作人员将会进行核查。


