Tuesday, March 5, 2024

How far can it go after the expected rise?

① 23:00 US February ISM Non-Manufacturing PMI
② 01:00 the next day, US Federal Reserve Director Barr participates in an online discussion

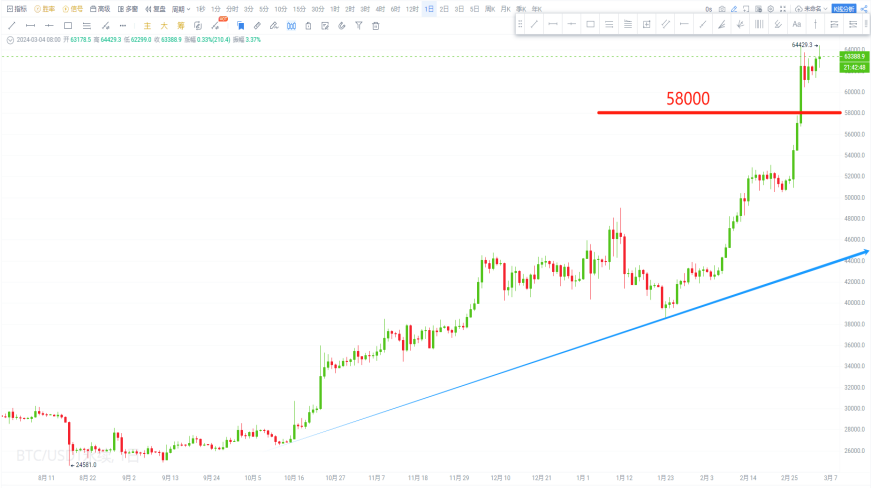
- Daily chart: After the price broke through the 58,000 level, it continued to rise. If the subsequent pullback does not break this support, the upward trend will continue.
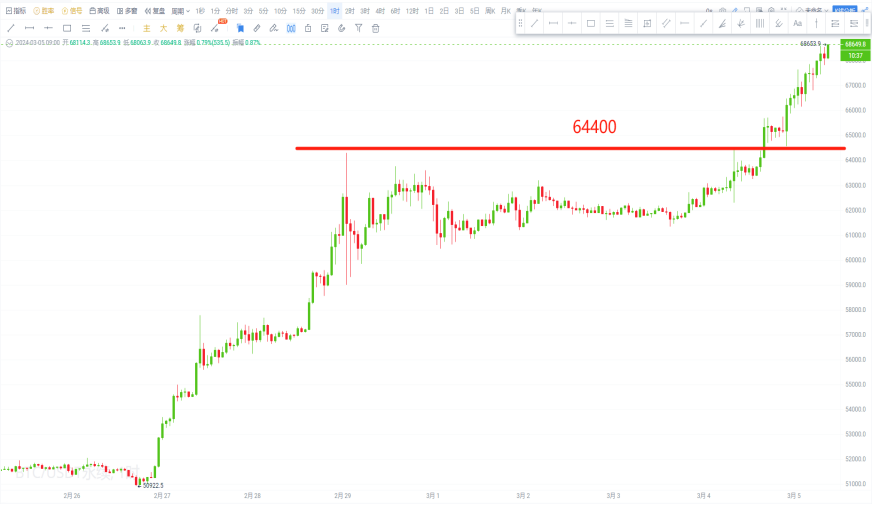
- 1-hour chart: After a short-term breakthrough above the 64,400 level, it continued to rise. If the subsequent pullback does not break this support, there is still a trend of further increase.
II. Ethereum
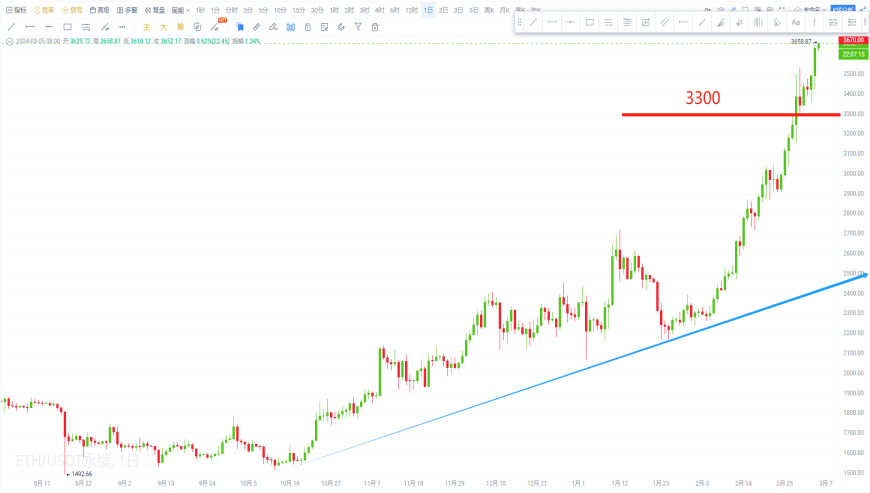
- Daily chart: After the price broke through the 3,300 level, it continued to rise. If the subsequent pullback does not break this support, there is still a trend of further increase.
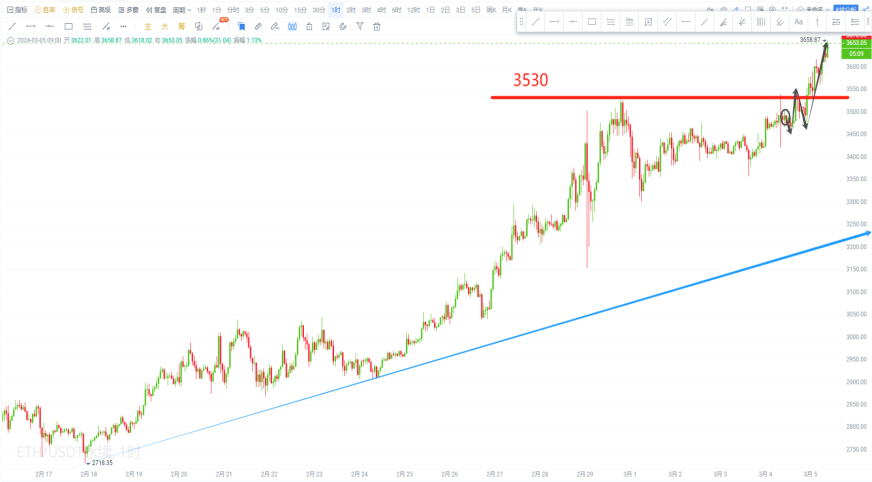
- 1-hour chart: After a short-term breakthrough above the 3,530 level, it continued to rise. If the subsequent pullback does not break this support, there is still a trend of further increase.


I. Bitcoin
- Yesterday's view:
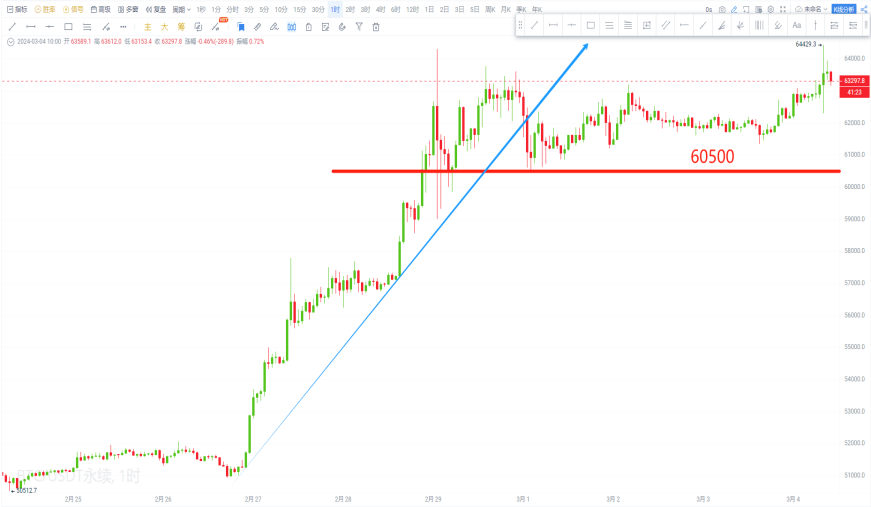
Summary: After the price broke through the 60,500 level in the short term, it maintained oscillation above it. If the subsequent pullback does not break this support, there is still a trend of further increase. The resistance above is at 64,300 and 67,000; if it breaks below, a pullback trend will unfold, with support below at 56,700 and 54,400.
- Subsequent trend:

The subsequent trend saw a significant rise after a pullback did not break the 60,500 level, and successfully reached the second target of 67,000, reaching a high of 68,653.
II. Ethereum
- Yesterday's view:
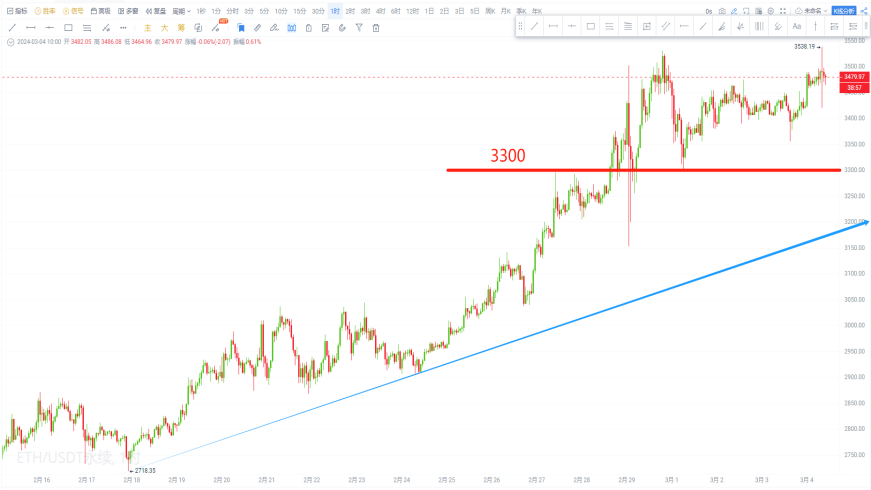
Summary: After the price broke through the 3,300 level in the short term, it maintained oscillation above it. If the subsequent pullback does not break this support, there is still a trend of further increase. The resistance above is at 3,580 and 3,730; if it breaks below, a pullback trend will unfold, with support below at 3,090 and 2,945.
- Subsequent trend:
The subsequent trend saw a slight pullback after not breaking the 3,300 level, followed by a significant rise, and successfully reached the first target of 3,580, reaching a high of 3,658.

I. Bitcoin
Summary: After the price broke through the 64,400 level in the short term, it continued to rise. If the subsequent pullback does not break this support, there is still a trend of further increase. The resistance above is at 71,000 and 73,000; if it breaks below, a pullback trend will unfold, with support below at 60,400 and 56,700.
II. Ethereum
Summary: After the price broke through the 3,530 level in the short term, it continued to rise. If the subsequent pullback does not break this support, there is still a trend of further increase. The resistance above is at 3,750 and 3,860; if it breaks below, a pullback trend will unfold, with support below at 3,380 and 3,270.


Join the community to enjoy the following services:
Morning video explanation updated daily;
Daily updated text and image viewpoints;
Technical indicator analysis and answers in the group;
Layout of long and short strategies;
High-winning short-term trading strategies;
Trading system long and short signals reference software authorization;
Enjoy lower transaction fees by joining the community for real trading;
One-on-one or one-on-many guidance and answers (by appointment);
Multiple learning materials gift package, bid farewell to not understanding;
Multiple analysts (lecturers, practical teachers) take you through the coin circle, with seven live courses daily
(Services are continuously being updated…)
For more details on services, you can download the Bubble Chat app and scan the code to join the group for inquiries……


免责声明:本文章仅代表作者个人观点,不代表本平台的立场和观点。本文章仅供信息分享,不构成对任何人的任何投资建议。用户与作者之间的任何争议,与本平台无关。如网页中刊载的文章或图片涉及侵权,请提供相关的权利证明和身份证明发送邮件到support@aicoin.com,本平台相关工作人员将会进行核查。


