Daily Sharing
Bitcoin experienced a surge to 53,000 last night, but failed to break through and fell back. Currently, we need to pay attention to whether it will continue to fluctuate in the range of 50,500 to 53,000, or if it will drop below 50,000 for a 4-hour level pullback.
After a significant rise, a pullback is inevitable. The extent of the pullback needs to be observed gradually.
BTC
Due to the rapid changes in the market, this article can only make predictions based on the market conditions at the time of publication. Short-term traders should pay attention to the latest market changes and use this information as a reference only.
1H:
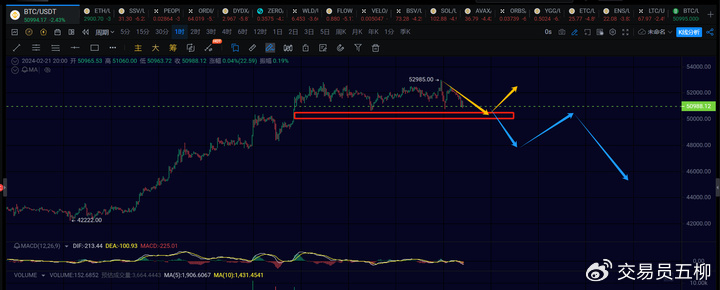
On the 1-hour chart, if Bitcoin experiences a pullback, we should first focus on whether the 50,000 to 50,500 range is broken. If it holds, Bitcoin is likely to continue fluctuating in the 50,500 to 53,000 range or rebound further above 53,000. If Bitcoin drops below 50,000, the next move should be a 4-hour level pullback, as indicated by the blue arrows in the chart.
Short-term support: 50,000 to 50,500 Short-term resistance: 53,000
15M:
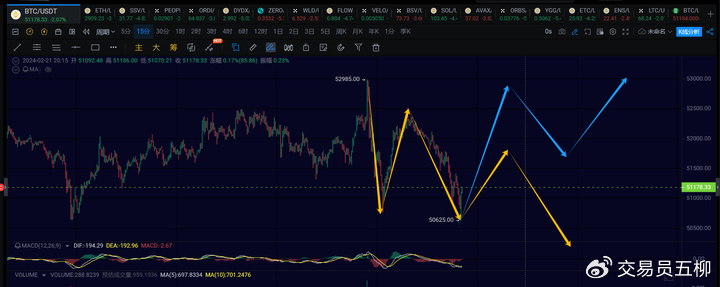
On the 15-minute chart, Bitcoin's third 15-minute level pullback has once again approached around 50,600. It is expected to experience a 15-minute level rebound here. Observing the strength of the rebound, if it can reach above 52,100, Bitcoin is likely to continue fluctuating or move upwards towards 54,000 to 55,000. If the 15-minute rebound does not reach 52,100, then further attention should be given to the support near 50,000.
ETH
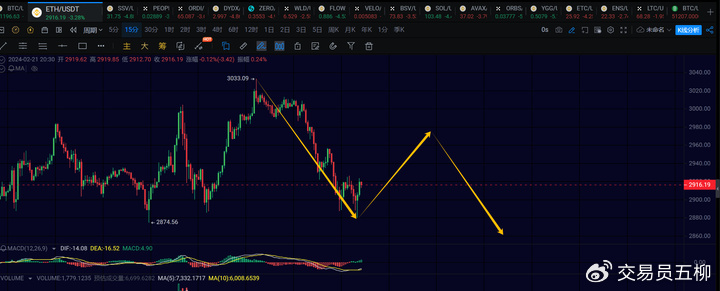
On the 15-minute chart, Ethereum is likely undergoing a 1-hour level pullback. It has already completed the first 15-minute level pullback and may be in the process of a second 15-minute level rebound. The upper resistance to watch is 2,980, and it is expected to experience a third 15-minute level downward movement. The support below is around 2,800.
Trend Direction
Weekly Chart: Upward trend, currently continuing the rebound from 15,476. Pay attention to the subsequent daily chart for when it might end.
Daily Chart: Upward trend, extending once again. End time is uncertain.
4-hour Chart: Upward trend, leaning towards Bitcoin encountering resistance near 54,000 to 55,000 and experiencing a 4-hour level pullback.
1-hour Chart: Downward trend, pay attention to the support range of 50,000 to 50,500 below. A drop below this range would indicate a 4-hour level pullback.
15-minute Chart: Upward trend, observe whether the 15-minute level rebound breaks through 52,100.
Feel free to follow my public account for further discussion and exchange:

The article is time-sensitive, so please be aware of the risks. The above is for personal reference only.
免责声明:本文章仅代表作者个人观点,不代表本平台的立场和观点。本文章仅供信息分享,不构成对任何人的任何投资建议。用户与作者之间的任何争议,与本平台无关。如网页中刊载的文章或图片涉及侵权,请提供相关的权利证明和身份证明发送邮件到support@aicoin.com,本平台相关工作人员将会进行核查。


