Click to watch the video: Master Chen 2.1 Video: RSI Indicator Looking for Medium and Long-term Buying Points, Is the Market Consolidating in the Medium and Long-term?
So these past two days, whenever Bitcoin has a slight increase, friends would ask me if they can still go long in the medium and long term, or if Bitcoin drops, they ask if they can still go short. It feels like there's no clear direction. I think the long positions that were previously set up still need to wait for profits. Currently, it's not an optimistic time. It's also not the top because there's still a possibility of further decline in the short term. So in today's video, we will discuss the buying point at 100x, including some knowledge from the charts.
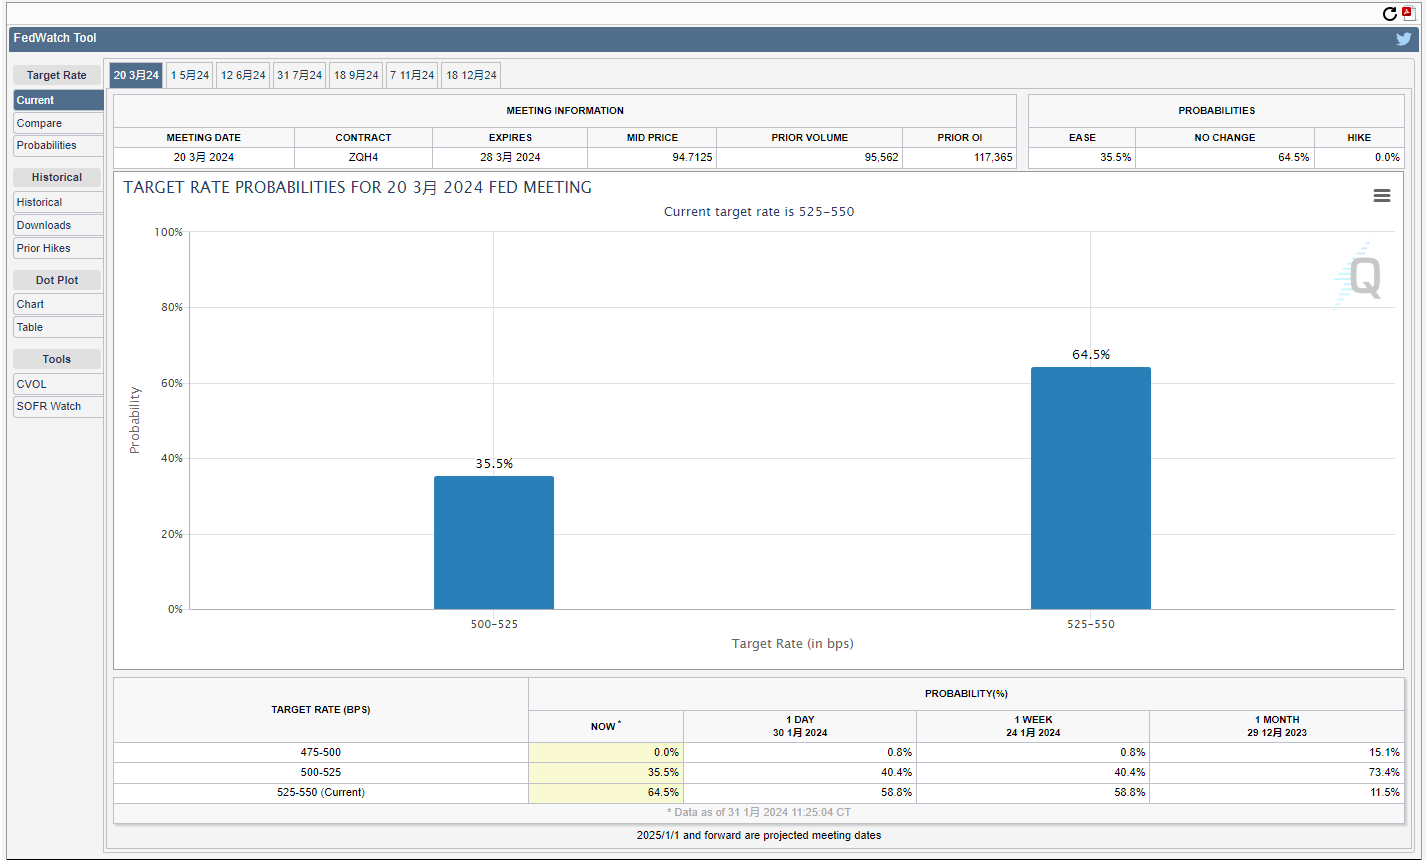
First, let's take a look at the Fed's interest rate decision. Because the Fed did not continue to raise interest rates last night, but we can take a look at the interest rate decision in March. There's a possibility of a rate cut, especially in March, with a 34% probability of a 35 basis point cut.
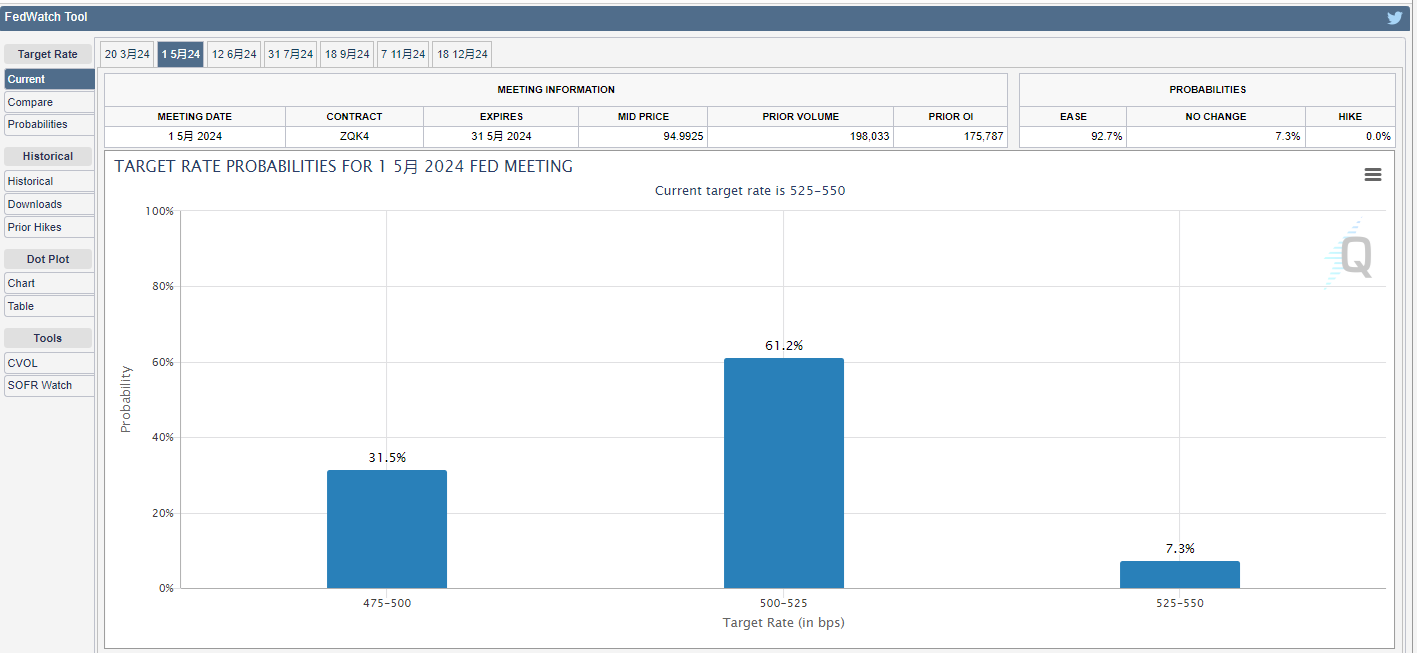
Or in May, we can observe the probability of a 25 basis point cut at 62%, or a 50 basis point cut at 30%.
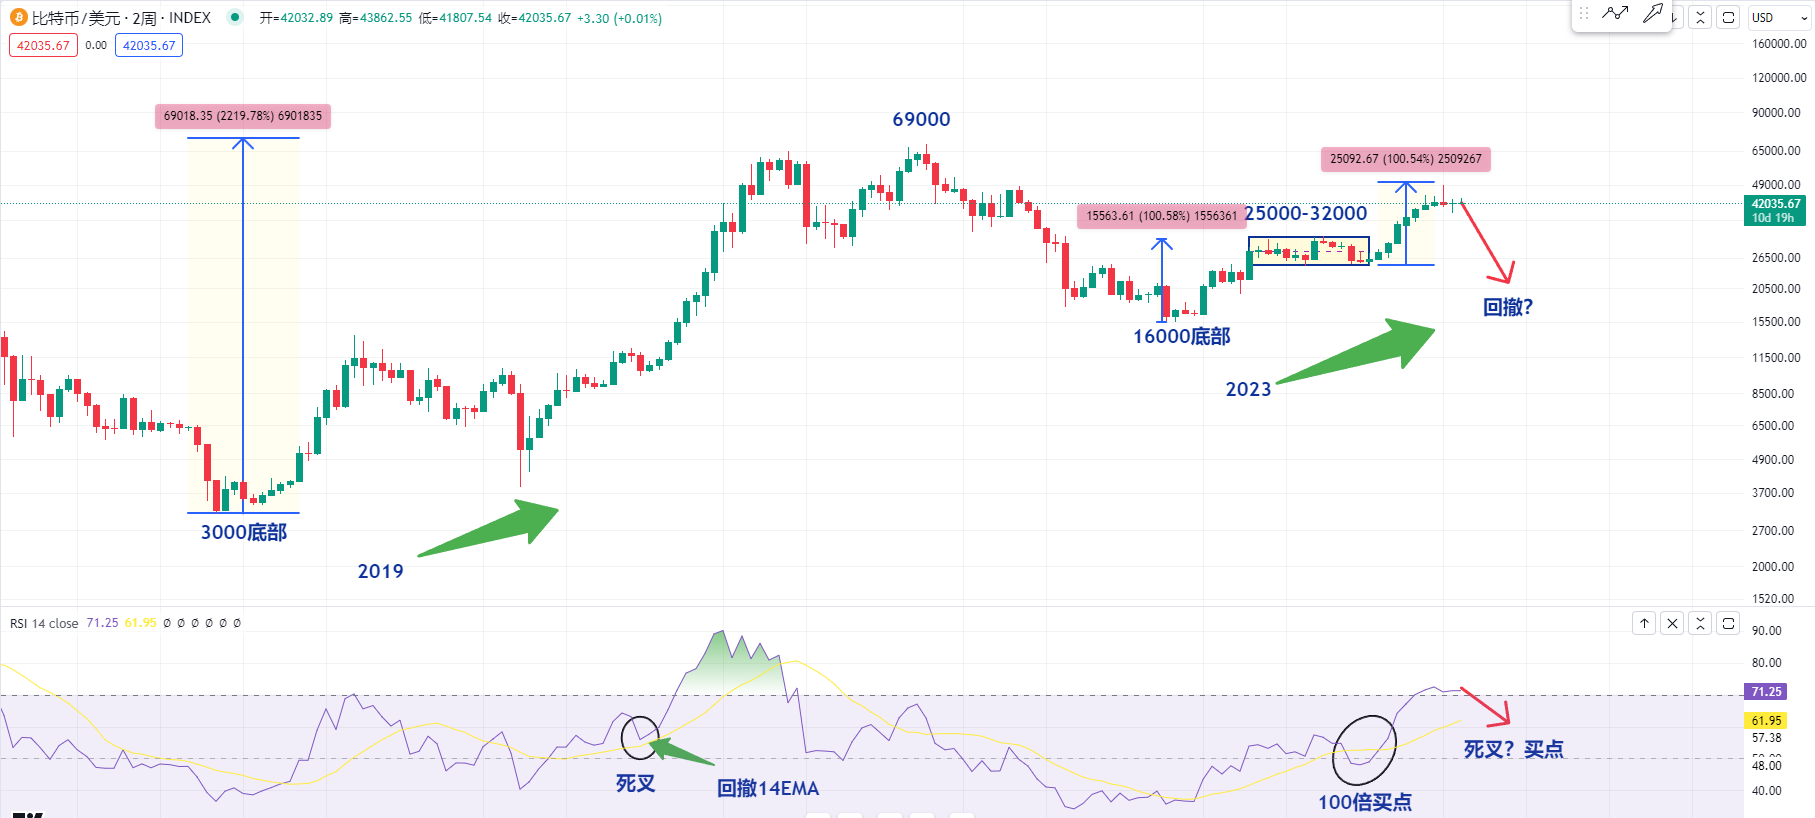
Then let's take a look at the 2-week chart of Bitcoin, especially how to find opportunities to continue buying at 100x. Let's first observe the price of Bitcoin. In the 2-week chart, its space has increased so much. Of course, for the long term, its increase is not much. It's just a concern that the short term increase might be too much, and there might be a retracement at this level, and a concern that the RSI indicator might have a death cross.
Then for the long term, everyone can calculate. The bottom of Bitcoin was around 16,000 at the beginning of 2023, or we can calculate based on the current price of 43,000. Then the bottom is at 16,000. Everyone can calculate. Currently, it has only increased by about 2.6 times.
Or we can take a look at Bitcoin in 2019. At that time, the bottom was around 3,000, and the subsequent top was at 69,000. We can calculate that its space has increased by 23 times. So, in the long term, my view is still the same. Don't worry about a 10% or more decline at the current level.
If you are in spot trading, you have to consider your own mentality. I think if you want to buy, you can buy directly because there will be even greater space in the future. If you are worried about the short-term decline at this level, then I think you are not suitable for trading. But for the medium and long term, and the short term, we have to be careful. In case the RSI indicator at the 2-week level below the current level has a death cross, it might be the next buying point.
For example, the previous Bitcoin in the range of 25,000-32,000. Because we observed from the chart, the space of the two rises is basically equal. Rising from 25,000 to this level is basically a 100% space.
So I think in terms of the form, it's this kind of form. I have mentioned before that it might be oscillating in the range. So, we observe from the RSI indicator at the bottom of this range. At that time, the buying point at 100x might be the position where the RSI indicator has a death cross.
Why is the death cross a buying point? Because some books say that the death cross is a sell signal, and the golden cross is a buy signal. But I think for the medium and long term, we should do the opposite. The death cross is the buying point, and the golden cross is the selling point.
So let's take a look at history again. When Bitcoin started from the bottom at the end of 2019, there was also a death cross here. It might be a very important buying point in the left side of the long-term level, including after the right side comes out.
We can observe that at a few positions, its RSI indicator retraced to the 14 moving average line. If there was no death cross, it would also be a very important buying point. Then we can observe the current Bitcoin at the position of 25,000, where there was a buying point with a death cross. Now, will there be more death crosses? It might be the opportunity for us to go long at 100x.
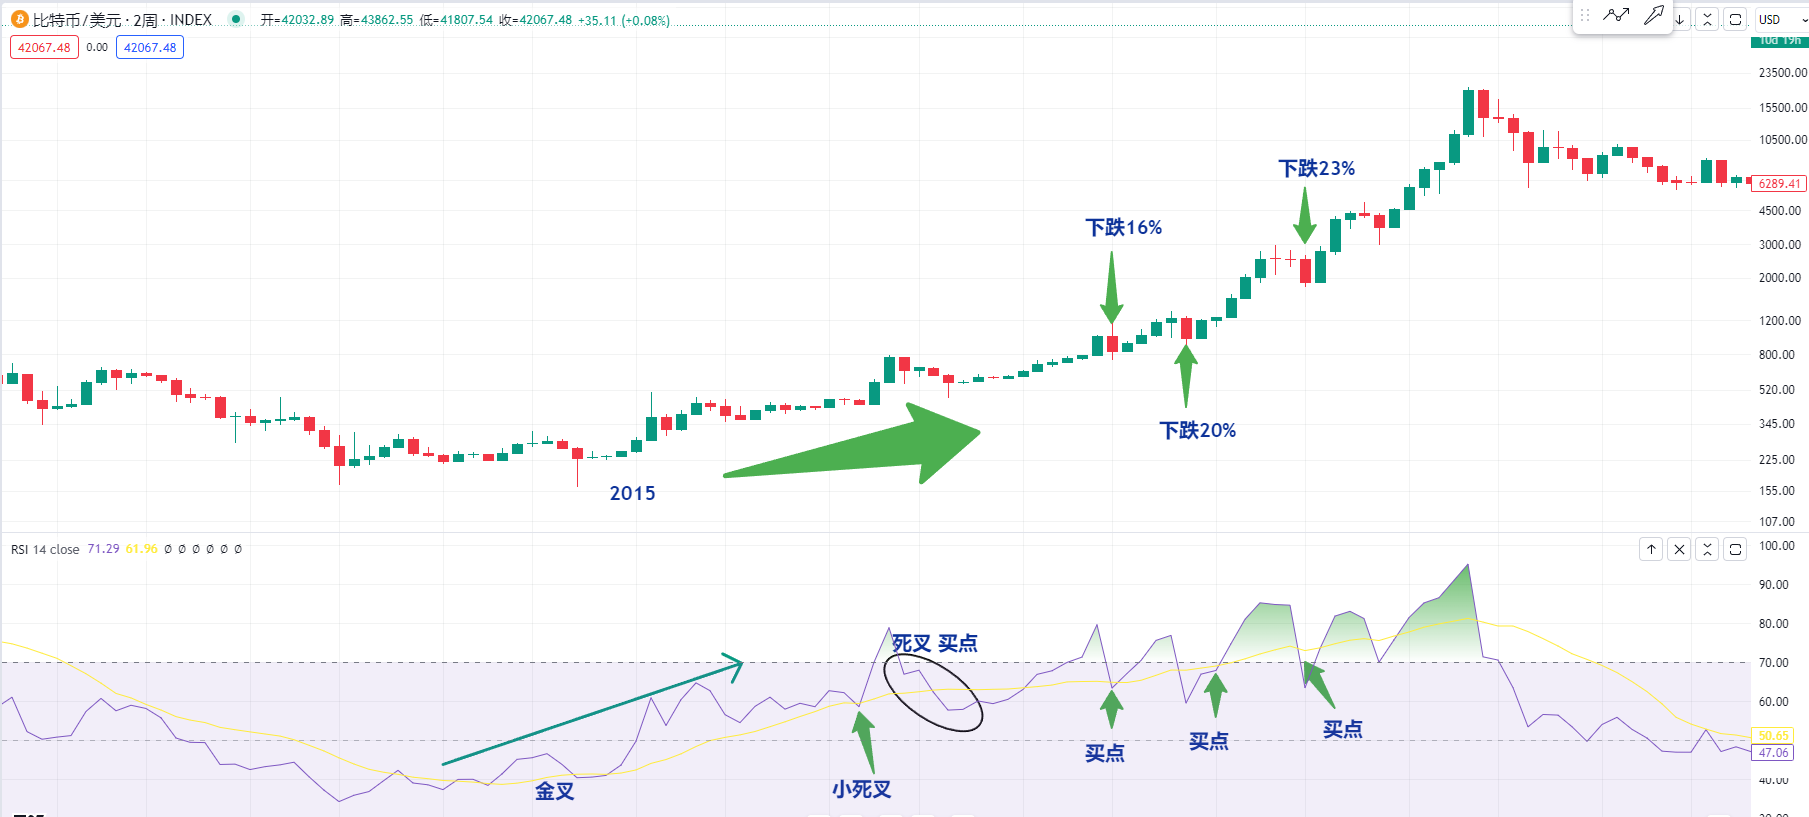
We can refer to the bull market of Bitcoin at the moment, which is very similar to the bull market from 2015 to 2017. Then let's take a look at the RSI indicator in 2015. After it started from the bottom at this position, it has been in a golden cross all the way, or there was a very small death cross at this position, which is a very important buying point.
Including, we can observe that after the halving of production, there was a collapse here, which is a death cross at this position, which might be a very important 100x buying point. Or we can observe the subsequent candlesticks, this big drop of 16%.
So, a death cross like this below is a very important buying point, or the subsequent candlestick dropping by 20%, the death cross below is also a buying point, including this candlestick dropping by 235, the death cross is also an important buying point.
So, if the current Bitcoin is very similar to the market from 2015 to 2017, I think we haven't seen a death cross now, so let's not consider this issue for now.
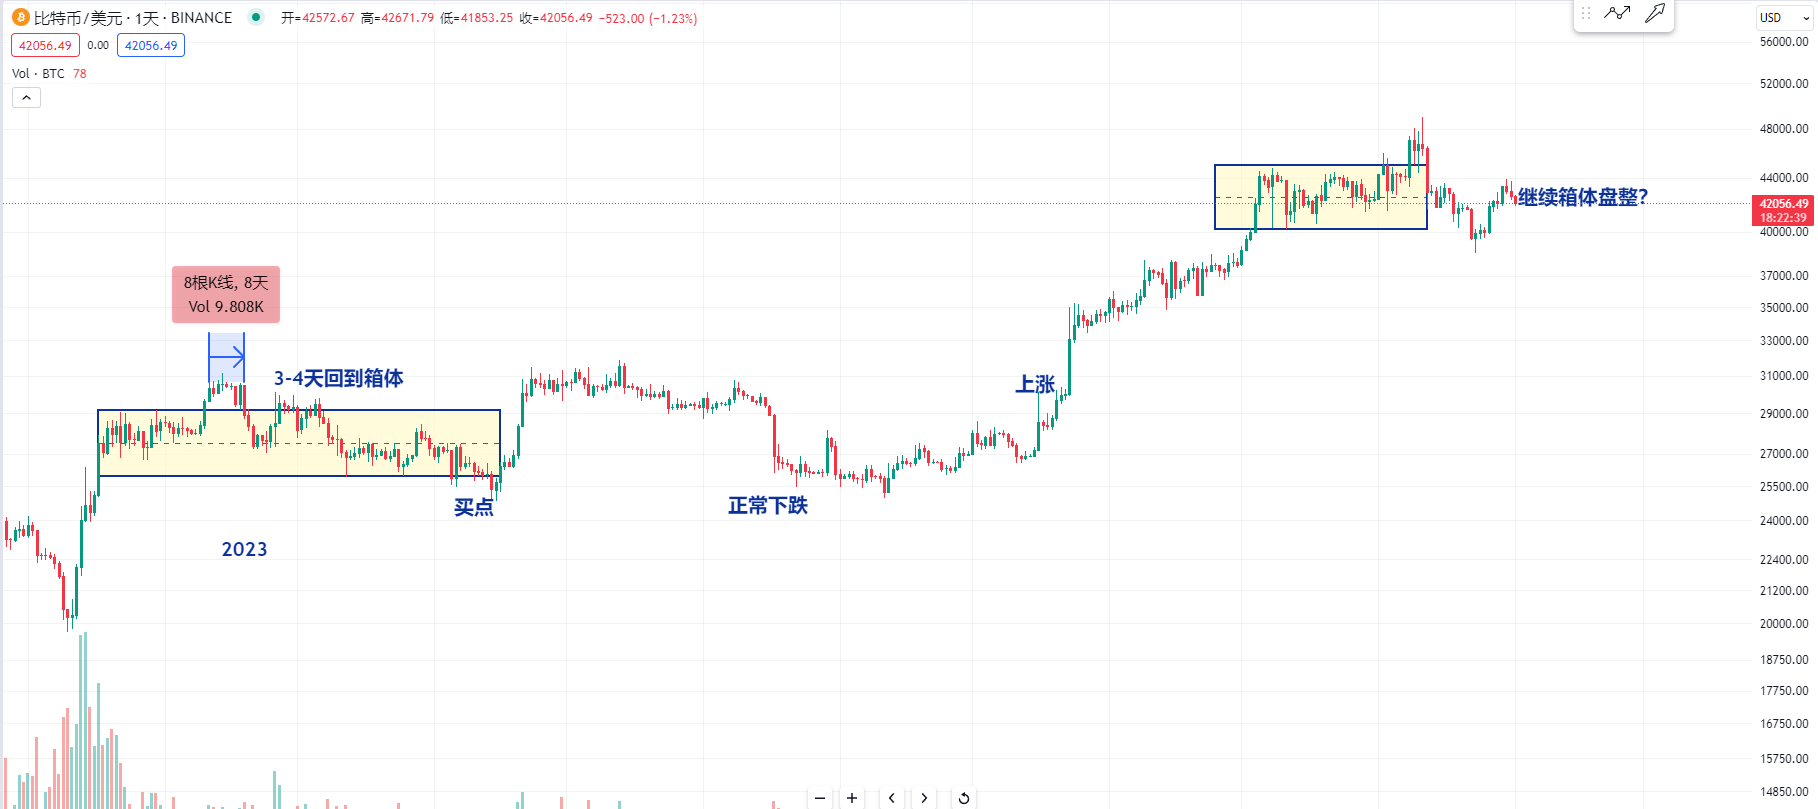
Since the current judgment still has the possibility of consolidating in the range, we should try to refer to the Bitcoin in the daily chart in 2023. At that time, at the low point of the collapse in April or the subsequent August, we can observe that the current range of consolidation is very similar to last year's range of consolidation.
After going up for about 8 days, it returned to this range, and after going up for 3 to 4 days, it returned to this range. After that, the position of breaking the low point might have a buying point, or the position of breaking the range might have a buying point. But then there was a decline, but the decline won't be very deep, and there will be an increase later. So, at the current position, we also need to consider that there might continue to consolidate in this range for some time.
For more strategies, you can add real trading.
Candlesticks are king, trends are emperor. I am Master Chen, focusing on BTC, ETH spot contracts for many years. There is no 100% method, only 100% trend following. Daily updates on macro analysis articles and technical analysis review videos on the entire network. 
Friendly reminder: This article is only written by Master Chen in the public account (as shown in the picture above). The end of the article and other advertisements in the comment area are not related to the author. Please be cautious in distinguishing between true and false. Thank you for reading.
免责声明:本文章仅代表作者个人观点,不代表本平台的立场和观点。本文章仅供信息分享,不构成对任何人的任何投资建议。用户与作者之间的任何争议,与本平台无关。如网页中刊载的文章或图片涉及侵权,请提供相关的权利证明和身份证明发送邮件到support@aicoin.com,本平台相关工作人员将会进行核查。


