This article is only a personal market view and does not constitute investment advice. If you operate according to this, you are responsible for your own gains and losses.
Less than 40%: The original "Beijing drift trader," a trend trader with a winning rate of less than 40%.
There is a lot of content in today's article, mainly divided into 3 parts. After reading, please share with your friends. Let's start with the theme and conclusion:
Recent market outlook - No new uptrend below 42,000 yuan
Bottom signal attention - USDT market share; Profit rate when selling after noise reduction - 14 days; Weighted average funding rate - 7 days
Pay attention to the trend and reasons for the 10-year Japanese government bond yield - Highly negatively correlated with global liquidity providers and the trend of risk assets (US stocks, cryptocurrency)
01
Recent market outlook
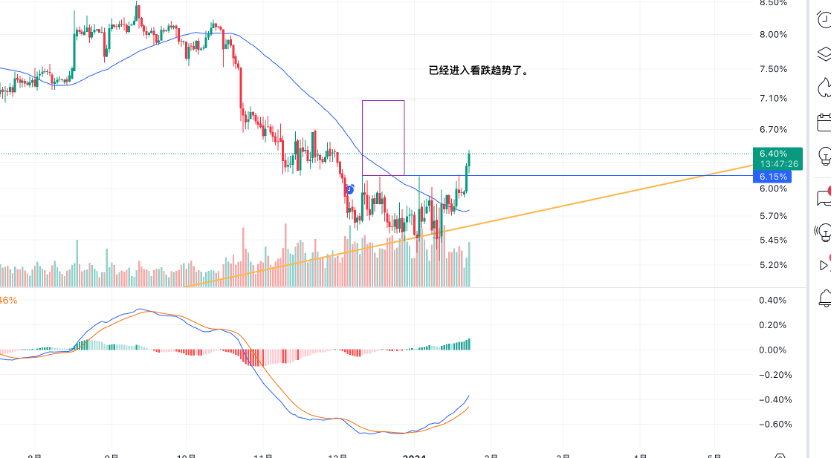
The viewpoints in the articles from January have been verified one by one. The price finally fell below 40,000 yuan this afternoon. From the trend of CME's BTC, it has broken two trend lines in a row, and both trend lines have accurately become resistance levels. Near the 36,000 yuan mark below is a Fibonacci level, which may provide support. Near the 42,000 yuan mark above is also a Fibonacci level, which will become a resistance level.
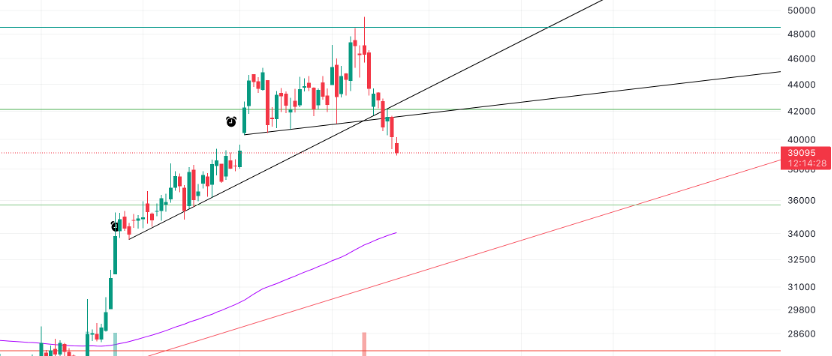
Moreover, from a technical perspective, BTC presents a downward flag pattern. The lower edge of the flag is also an accurate rebound resistance level. According to the pattern calculation, the downside target should be around 35,700 yuan.
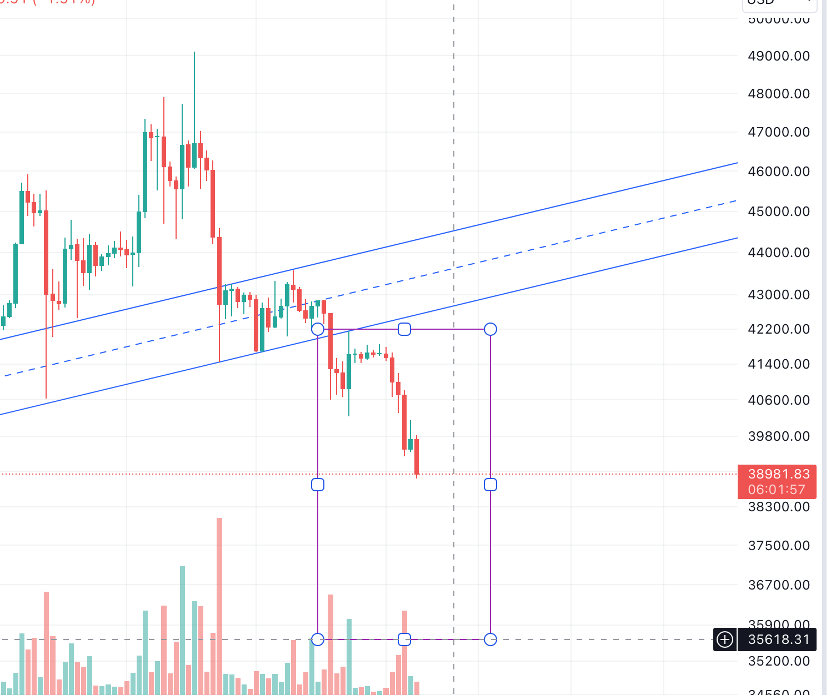
Taking everything into consideration, partial buying can be done near 36,000 yuan or waiting for other bottoming signals. At least after stabilizing above 42,000 yuan, considering a bullish view. 42,000 yuan is also the rebound high point on January 20, the previous high resistance level.
As mentioned in previous articles, this pullback is a process of repairing indicators at the 3D level, which will take a longer time. Plus, there are no significant positive factors, so the probability of a V-shaped rebound is low. There may be rebounds in between, but it's unlikely to start a new uptrend (you can review several articles published this month).
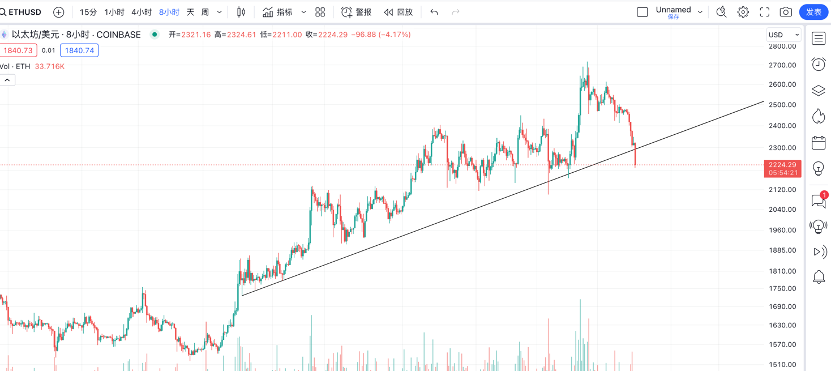
In the overall downward market situation, ETH also cannot maintain an independent trend. ETH has also fallen below the uptrend line since late October, and the outlook is not optimistic.
02
Reference for several bottom indicators
- USDT market share
The indicator of USDT market share was mentioned in the article on January 4. Here, only the conclusion will be discussed. The indicator shows a bottoming head and shoulders pattern, and the market share is expected to rise to around 7%, corresponding to the cryptocurrency market price around October 23. Also, pay attention to the 20-day moving average. When this indicator crosses below the 20-day indicator again, a new uptrend may begin.
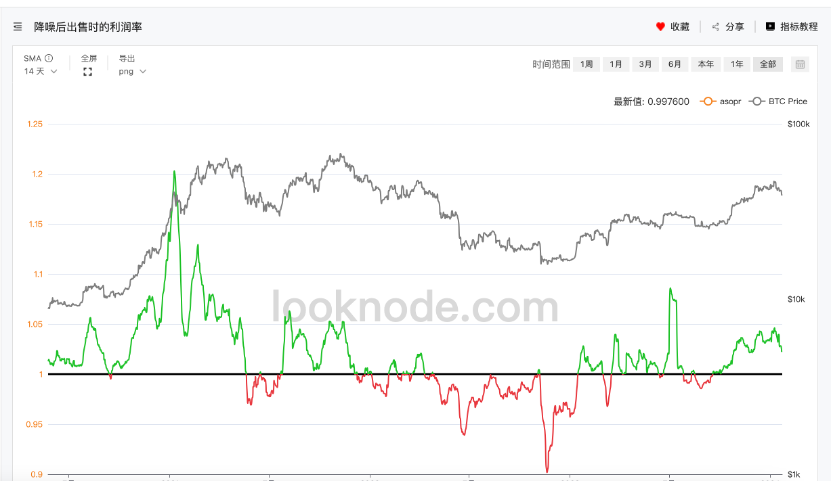
- Profit rate when selling after noise reduction - 14 days
Since 2020, this indicator has basically corresponded to entering the negative value range at the bottom of the phase. It is unknown whether it will enter the negative value range this time. But keep an eye on it. If it enters the negative value range again and returns above the 0 axis, a new trend is likely to begin.
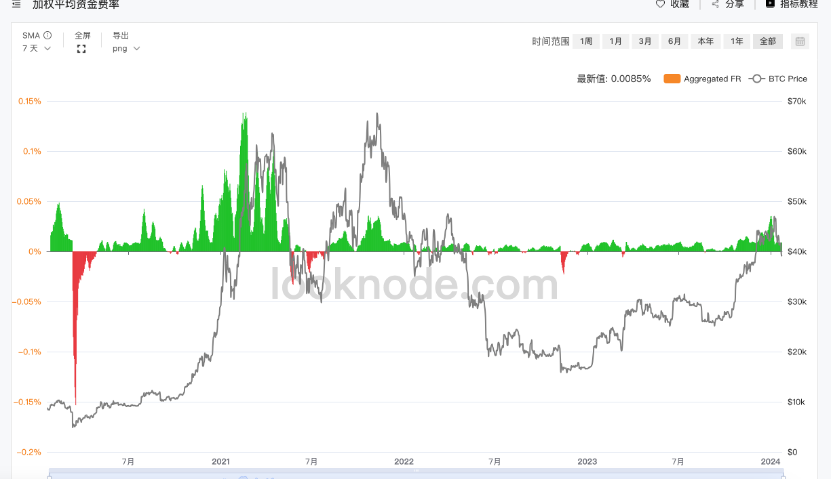
- Weighted average funding rate - 7 days
This indicator has been mentioned many times before. Historically, its accuracy is quite high. When the 7-day average rate is negative, it is basically a bottom. Combined with the price, pattern, and trend at that time, it is very helpful in judging the effectiveness of the bottom.
03
Pay attention to the 10-year Japanese government bond yield
Japan is a global interest rate lowland, providing a large amount of arbitrage funds globally. At the end of July 2023, the Bank of Japan began adjusting the YCC plan, raising the upper limit of its 10-year government bond yield management to 1%. Those interested can find some videos to learn about YCC-related knowledge, no further explanation. Just the conclusion.
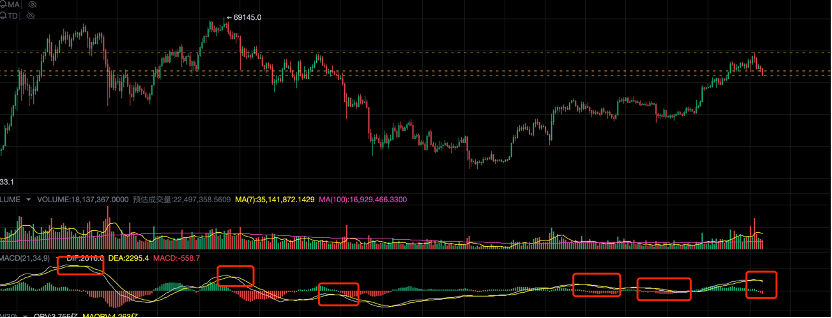
Its 10-year government bond yield and the trend of risk assets show a clear negative correlation. When the yield rises, global asset prices come under pressure. Moreover, there is an expectation of interest rate hikes in Japan this year. If the Bank of Japan does raise interest rates, it will have a significant impact on the global market. Below is a comparison of the trend of the 10-year Japanese government bond yield and the Nasdaq.
It can be clearly seen that after the upper limit of the 10-year government bond yield was raised to 1% at the end of July, the trend of the Nasdaq and its yield showed a highly negative correlation. The higher the yield, the lower the Nasdaq. The peak of the yield appeared on November 1 (0.955%), and the second highest point was on October 26 (0.892%). The time difference is not significant, and since the rate was close to the upper limit on October 26, it explains the rush to buy assets.
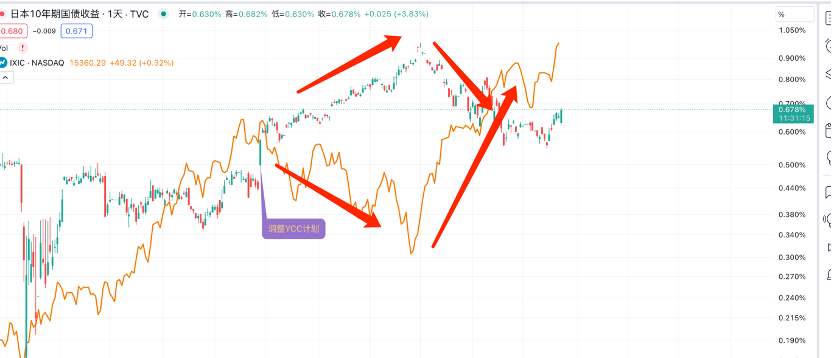
During the subsequent decline in the yield, the Nasdaq rose all the way. Its lowest point in yield was around 0.55%, which is basically close to the lower limit. Currently, the yield is showing signs of rising again. In this regard, the rise of the Nasdaq may not go very far.
Looking at the comparison between the trend of the cryptocurrency market and the 10-year Japanese government bond yield. Here, the total market value of the cryptocurrency market is used as a reference, rather than a single currency.
During the first phase when the Japanese bond yield began to rise at the end of July, the entire cryptocurrency market also started its downward trend. However, the cryptocurrency market's bottom reversal time is earlier than that of the Nasdaq and the Japanese bond yield. Basically, the cryptocurrency market can be considered to have started a new uptrend from October 20.
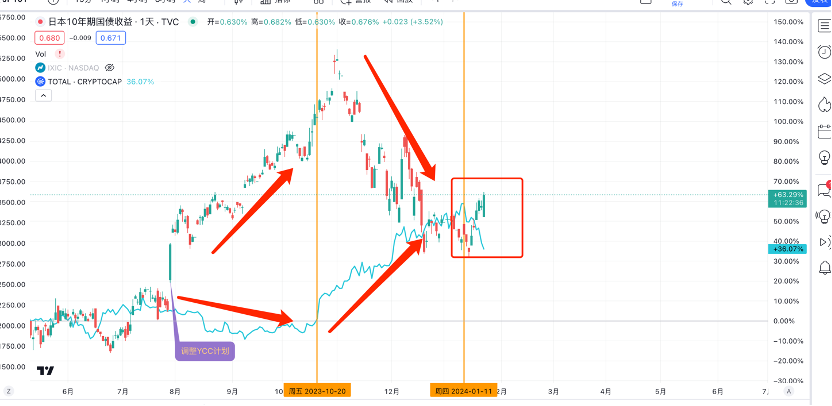
After the Japanese bond yield began to decline, the entire cryptocurrency market rose. The second yellow vertical line in the chart is the recent high point of the total market value of the cryptocurrency market, which also corresponds to the low point of the Japanese bond yield. It can be seen that the overall trend of the cryptocurrency market is also highly negatively correlated with the Japanese bond yield.
Therefore, this is obviously a reference indicator. Two meaningful values are below 0.6% (possibly the peak of the cryptocurrency market) and above 0.85% (possibly the bottom of the cryptocurrency market).
I personally think it is still worth considering, evaluating from multiple angles to be prepared.
Follow me and maximize trend profits with minimal operations.
免责声明:本文章仅代表作者个人观点,不代表本平台的立场和观点。本文章仅供信息分享,不构成对任何人的任何投资建议。用户与作者之间的任何争议,与本平台无关。如网页中刊载的文章或图片涉及侵权,请提供相关的权利证明和身份证明发送邮件到support@aicoin.com,本平台相关工作人员将会进行核查。


