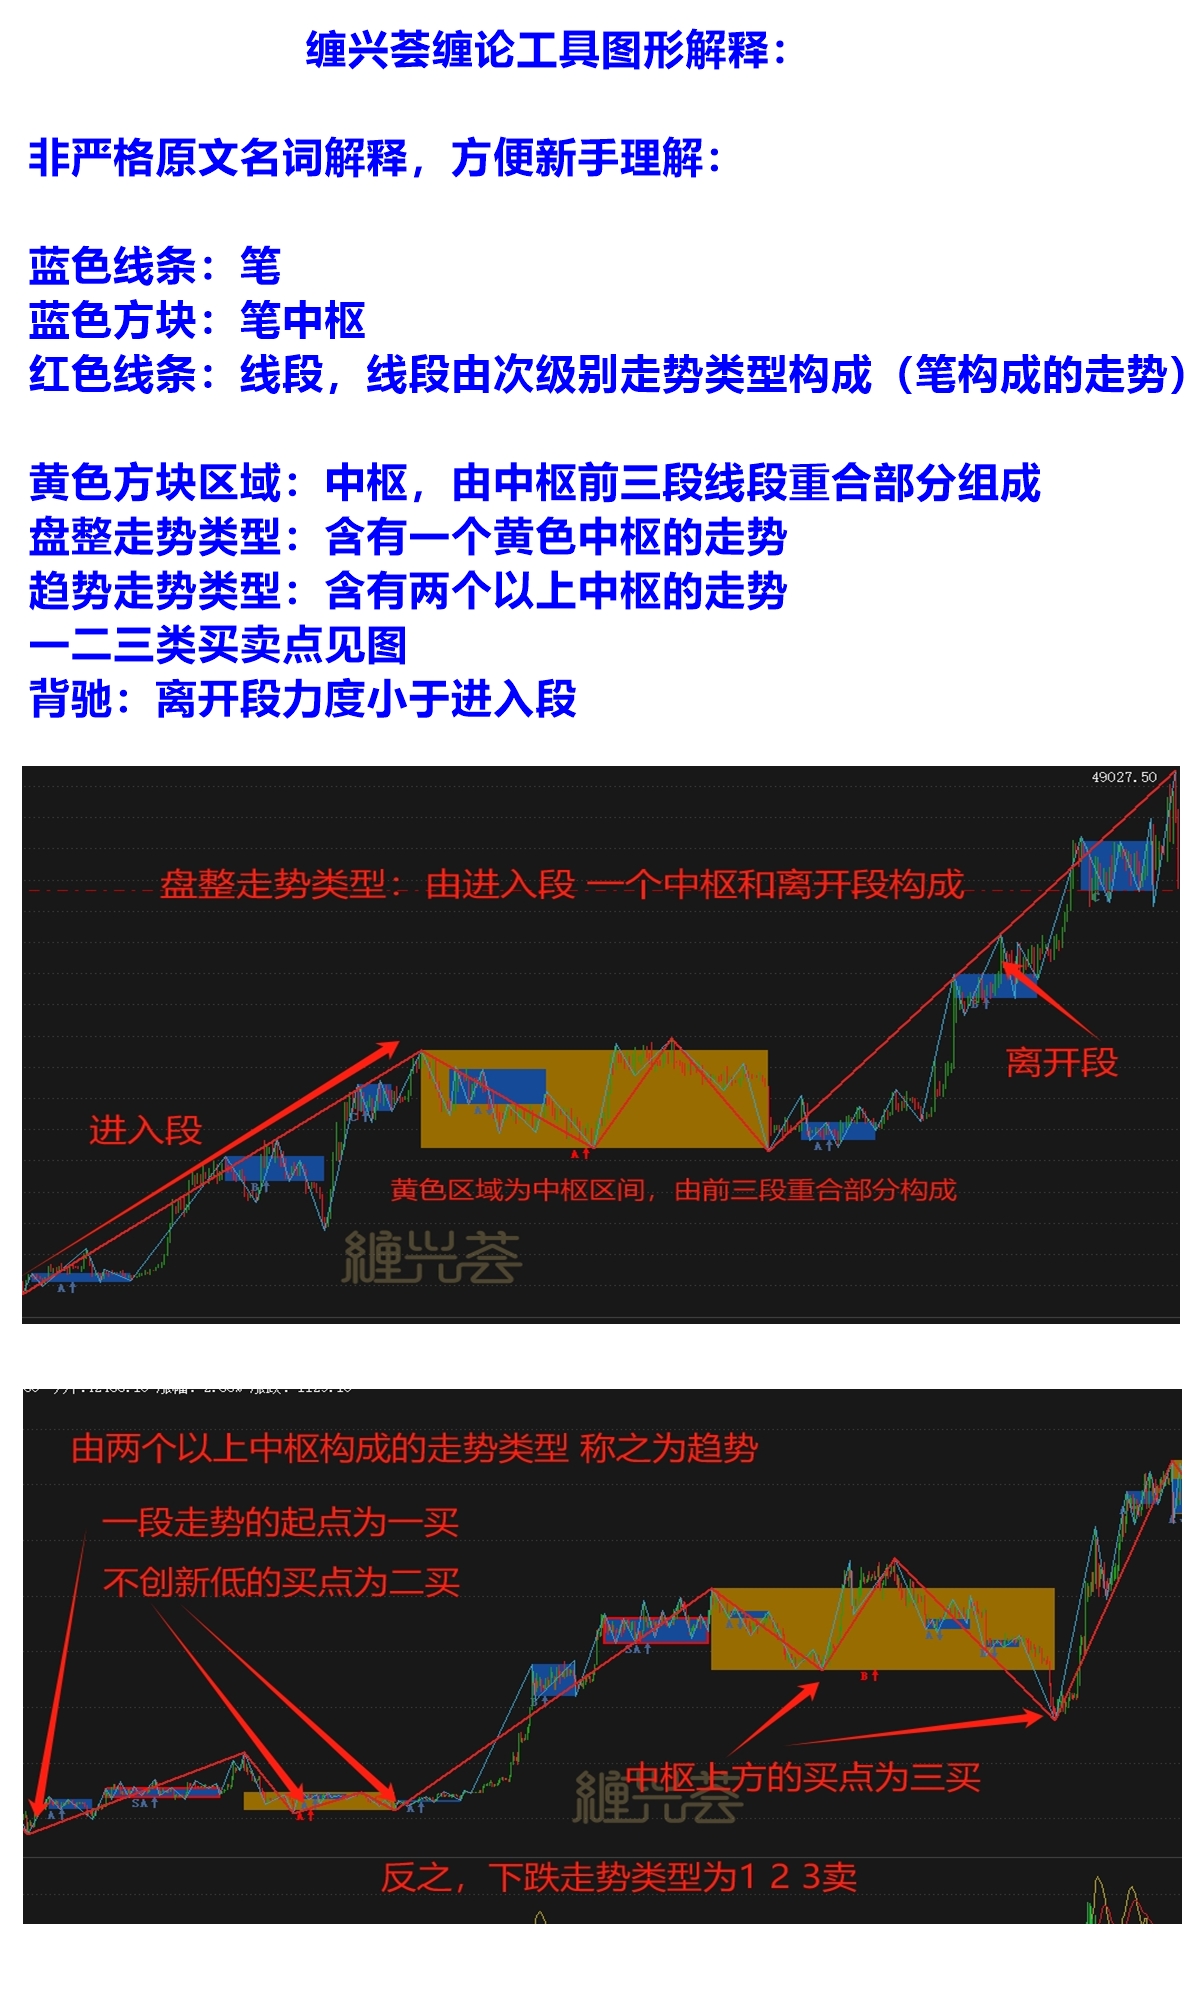
To facilitate everyone's understanding through the images, here are some explanations of the terms:
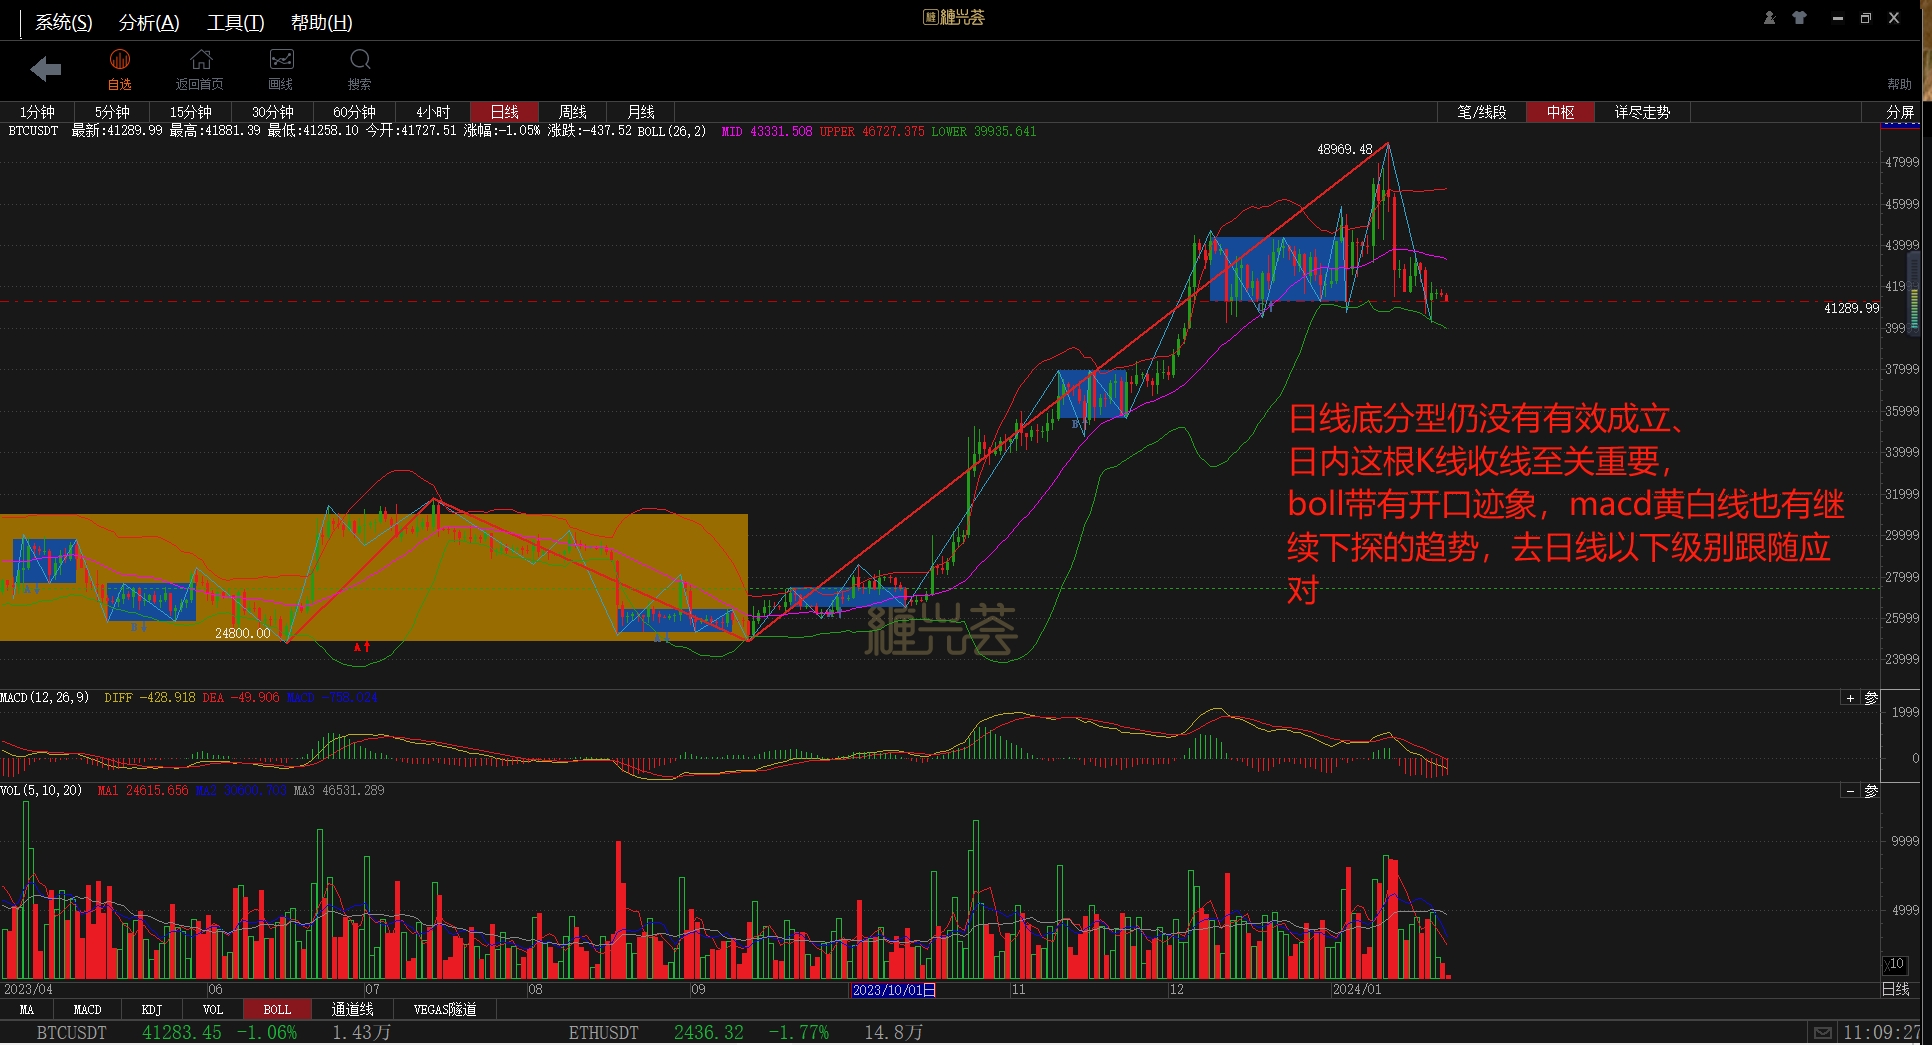
The daily chart of the big cake still has not formed an effective bottoming pattern. The closing of this candlestick is crucial. There are signs of the Bollinger Bands opening, and the MACD yellow-white line also shows a continuing downward trend. It is necessary to follow and respond to the levels below the daily chart.
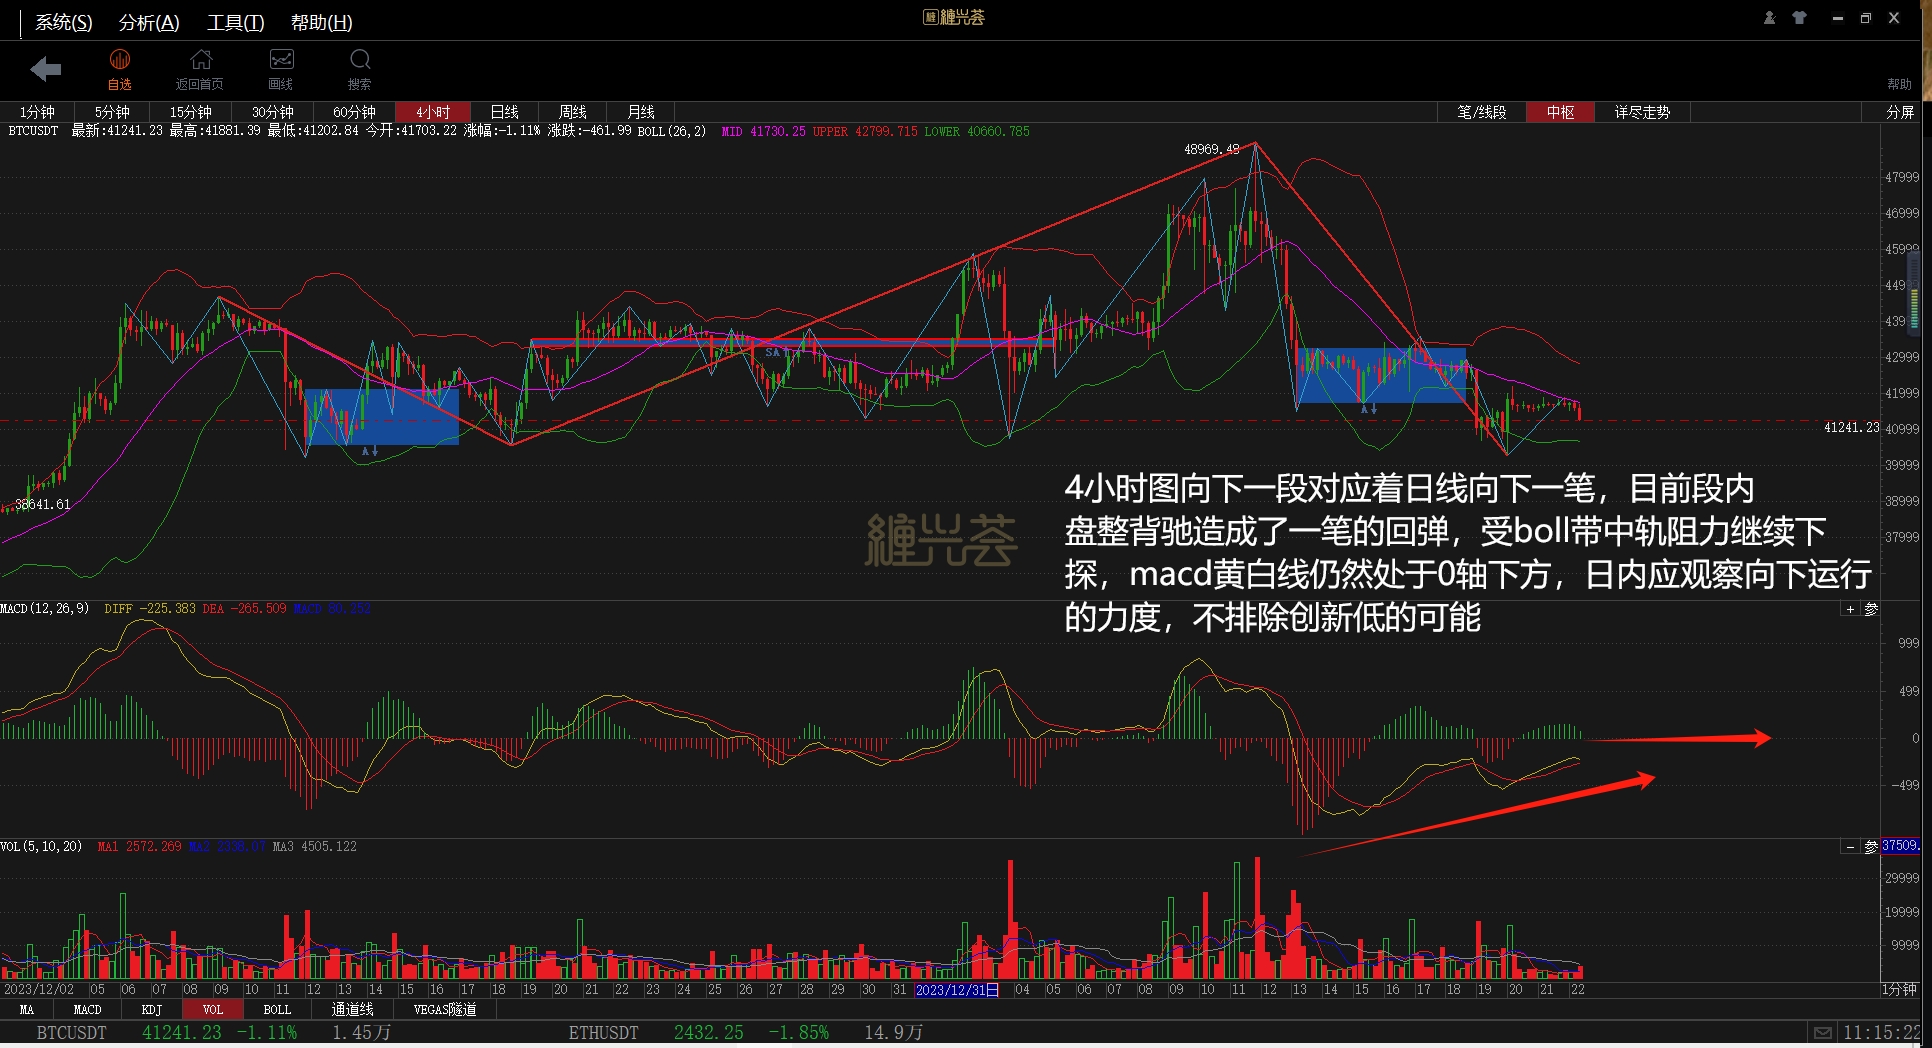
The downward trend on the 4-hour chart corresponds to a downward trend on the daily chart. The consolidation and divergence have caused a rebound, but it is still facing resistance at the midline of the Bollinger Bands, and the MACD yellow-white line is still below the zero axis. It is necessary to observe the strength of the downward movement during the day, and the possibility of making new lows cannot be ruled out.
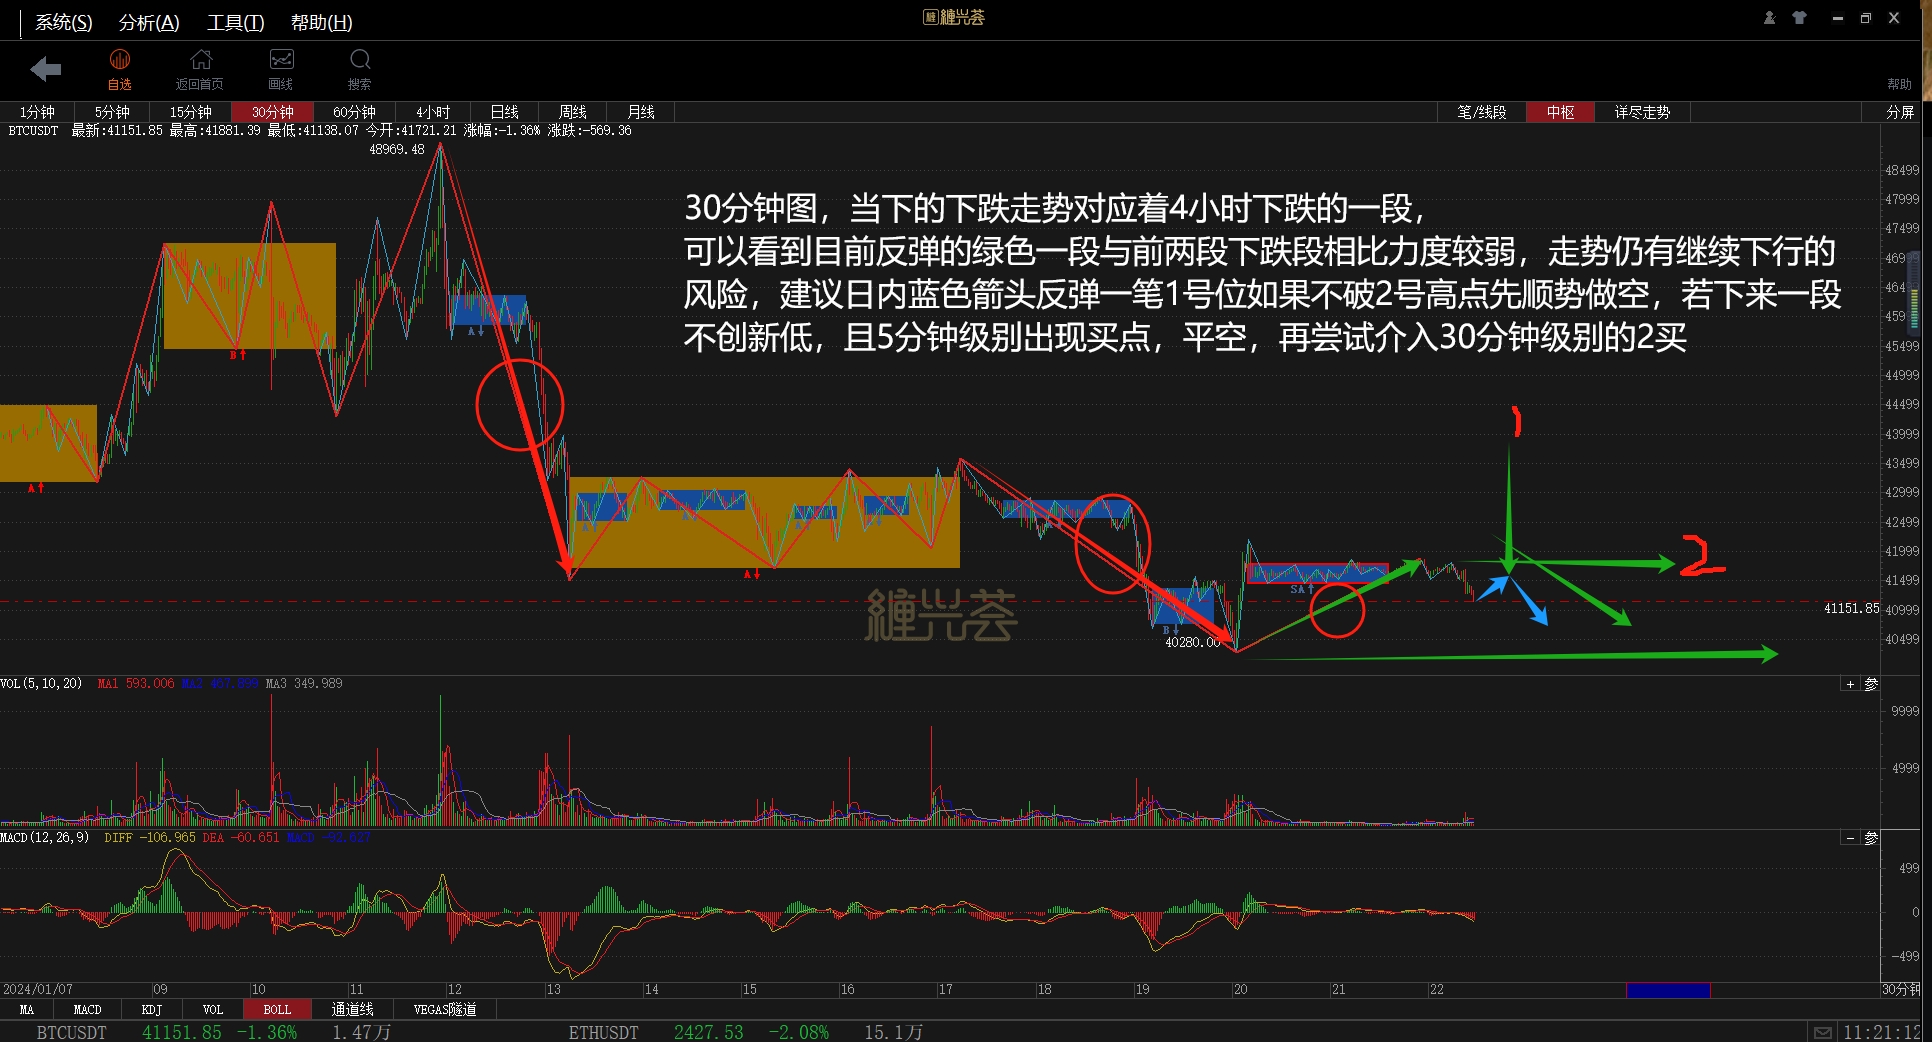
On the 30-minute chart, the current downward trend corresponds to a downward trend on the 4-hour chart. It can be seen that the current rebound (green segment) is weaker compared to the previous two downward segments. The trend still carries the risk of continuing to decline. It is suggested that if the blue arrow rebounds and does not break the high point of the 2nd, it is advisable to go short with the trend. If the next downward segment does not make a new low and a buying point appears on the 5-minute chart, close the short position and try to enter the 30-minute chart's 2nd buying point.
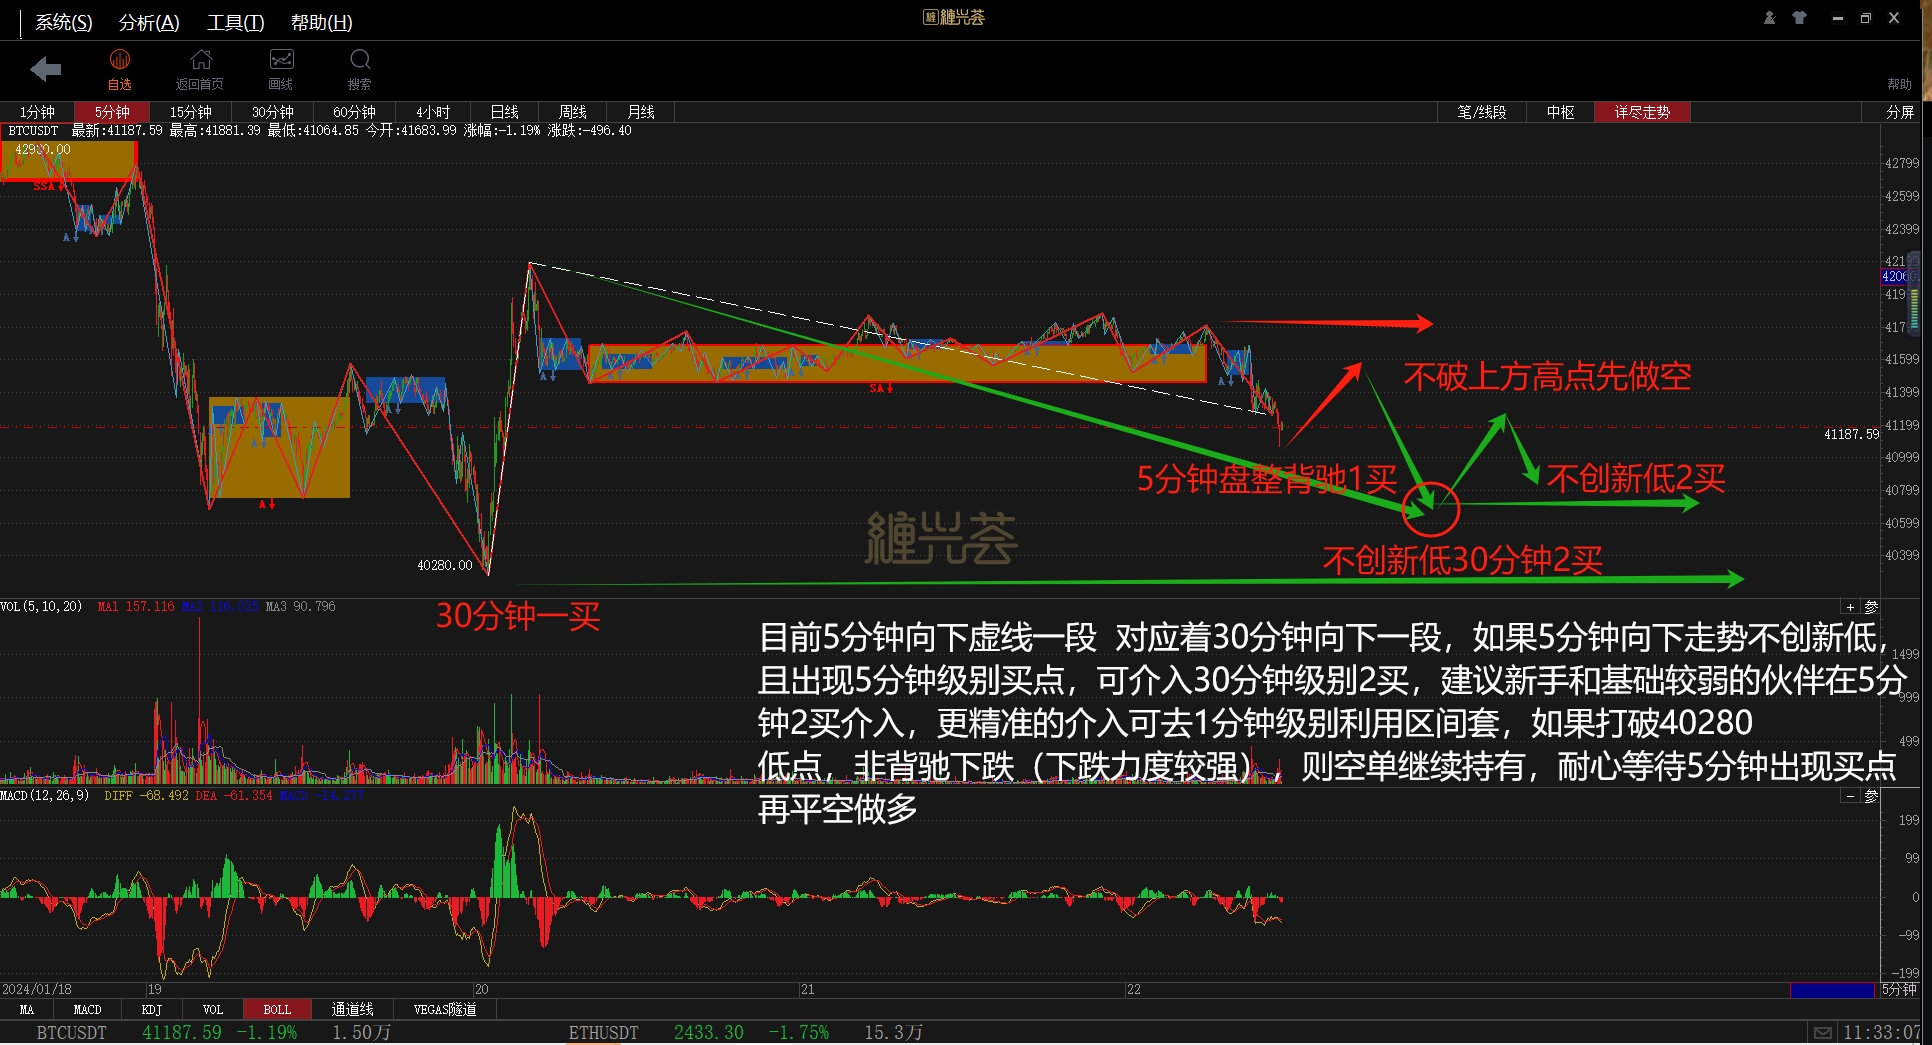
Currently, the downward dashed line on the 5-minute chart corresponds to a downward trend on the 30-minute chart. If the downward trend on the 5-minute chart does not make a new low and a buying point appears on the 5-minute chart, it is possible to enter the 30-minute chart's 2nd buying point. It is recommended for beginners and those with weaker foundations to enter at the 5-minute 2nd buying point. For more precise entry, you can use the 1-minute chart for range trading. If the low point of 40280 is broken and it is not a divergence-driven strong downward movement, continue to hold the short position and patiently wait for a buying point to appear on the 5-minute chart before closing the short position and going long.
The "Chaos Theory" is a rigorous trading system that combines mathematics and geometric logic to deal with the life, residence, decay, and destruction of trends from the perspectives of dynamics and forms. Trading is about human nature, and human greed, anger, ignorance, slowness, and doubt constitute the most expensive patterns. What we need to do is to use our eyes and discipline to decide our actions, rather than fantasizing, predicting, or being greedy. We should buy at buying points, sell at selling points, and follow the growth of the trend from small timeframes to large timeframes, just like a flower blooming. With a weekly timeframe for buying and selling points, we can even enter precisely from the 1-minute chart. This is the charm of the "Chaos Theory," and we are grateful to the Zen master.
[Feel free to leave comments. If you like my analysis, you can also leave the cryptocurrency you want to analyze in the comment section.]
[If you also like the "Chaos Theory" and want to learn and communicate about it, you can search for CZSC1319 on WeChat to join the "Chaos Theory Community" for more exciting market analysis and opportunities to share with you.]
免责声明:本文章仅代表作者个人观点,不代表本平台的立场和观点。本文章仅供信息分享,不构成对任何人的任何投资建议。用户与作者之间的任何争议,与本平台无关。如网页中刊载的文章或图片涉及侵权,请提供相关的权利证明和身份证明发送邮件到support@aicoin.com,本平台相关工作人员将会进行核查。


