臣本布衣,躬耕于南阳,苟全性命于乱市,不求闻达于诸侯,但求无愧于心。我很喜欢罗伯特.T.清崎的一句话,贪财乃万恶之源,贫困乃万恶之本。我相信大家在币圈都是为了能有利可图。希望接下来的日子里,我的行情分析能帮助大家在币圈中收获颇多,学海无涯,学无止境,不断的增加自己得学识,结合自己得操作习惯,才能在币圈中永存并实现自己的抱负。
首先我们来分析一下大饼和以太,ordi, xrp 的近期行情走势分析。
大饼,BTC从49000一度回调到41500,目前报价42600附近,首先对于大饼,我有很多话想说,这次给大家分析的透彻一点,48969.48币安现货报价,首先这个价格就不是人为能创造出来的,最起码是机器人操盘的数据,从周线来看,收线上影锤子线,属于空头的形态,周线后续走弱是非常正常的,日线级别来看,日线是从2023年10月15号开始到现在,第一次BTC跌破日线级别MA30均线(43300附近),并且我们看到日线MA60的支撑41500位置,目前虽然支撑住了,并且行情日线可能会继续走弱,由于时间换空间的关系,MA120均线38000附近的支撑,我认为才是最可靠且最真实的,当BTC严格意义上跌破MA120均线位置,那么宣布牛市行情已经结束。4小时级别来看,三线全部跌破,并且形成死叉,行情是非常的偏空头,目前在41500-43200附近震荡,1小时线看,目前是布林带低轨附近,整体上还是止跌了,且41500,41700,触碰了两次,个人人为这个位置会出现一定程度的反弹,但是这个反弹千万不要去追多,尽量在上轨附近开空比较稳妥,或者低轨做多,但是要带好41500的止损,因为我感觉大饼的趋势会去38000附近一带,不管是以何种方式去,我认为现货38000抄底是最正确的选择。我的建议是:短期存在反弹迹象,操作上低多点位41800-42000附近做多,止盈在43800-44000附近(记住行情如果反弹到这个位置别去追涨,容易被埋)。高空的话,我建议43800附近就可以开始布局空单,目标看37500-38000附近一带。

以太,ETH最高2700附近跌到2450附近,目前报价2540,日线级别来看的话,还算比较强势,目前还没有去触碰MA30均线2350位置,4小时级别来看,是处于一个下降趋势中,但是MA30均线这个位置没有跌破,并且,均线支撑还比较强硬,整体上建议还是以低多为主,1小时线看,目前处于2450-2580区间震荡,整体上我建议还是在这个区间做高抛低吸比较合适,所以我的建议是:低多位置2480附近,止盈位置2640附近。

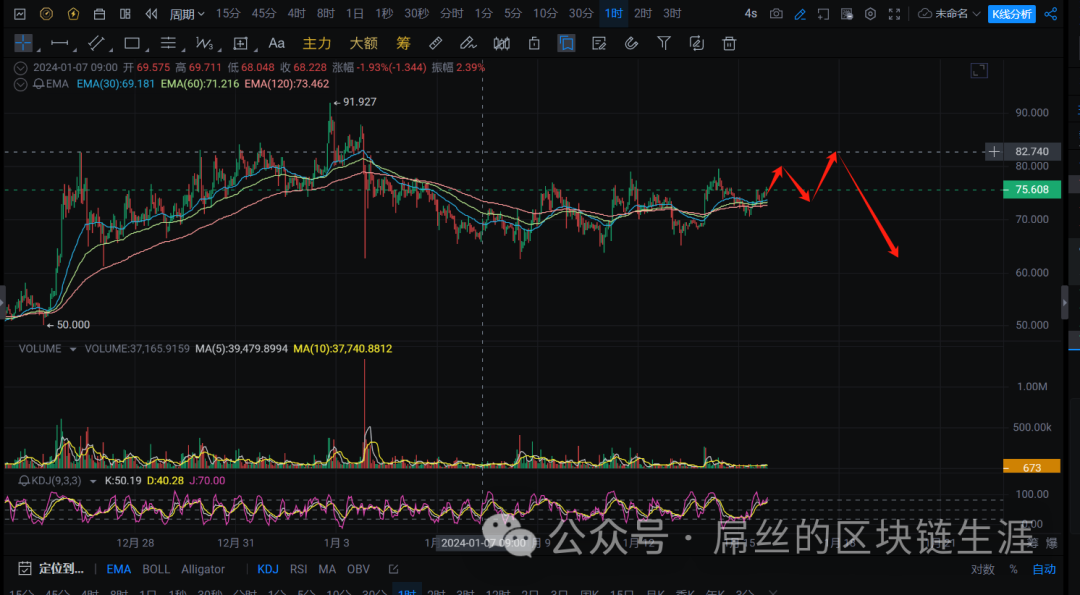
奥迪,ordi日线级别来看,目前MA30均线支撑住,整体上还是偏多头行情,4小时级别来看,目前三线交叉,且价格在65-78附近做一个区间震荡,个人猜测,如果奥迪做头肩顶形态,目前82为止还没到,所以低多的朋友不用太过于担心,如果出现头肩顶的话,那么建议82位置下车比较安全,1小时看,均线与价格来回交叉,或许很快就会出变盘方面,整体上建议低多比较合适,点位71附近,所以我的建议是:71附近做低多,82位置止盈即可,如果跌破65,那么就不建议在持有奥迪现货,因为形态一旦走坏,很难修复上来。
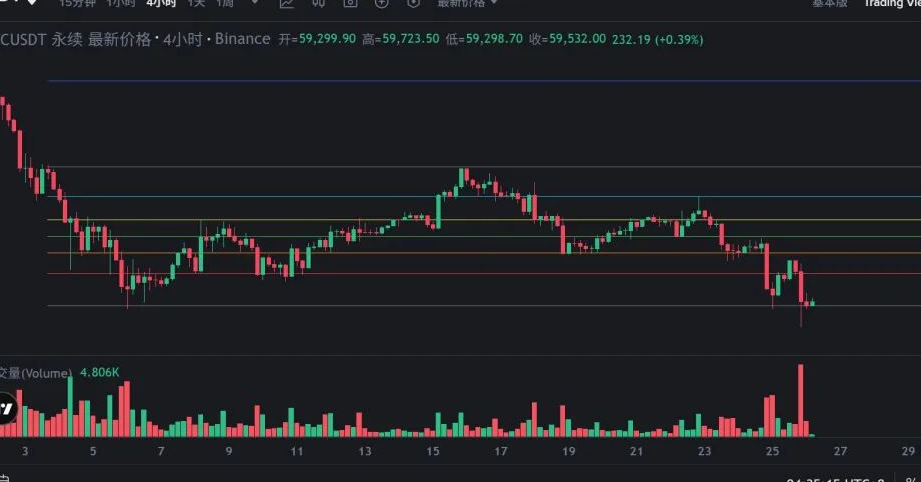
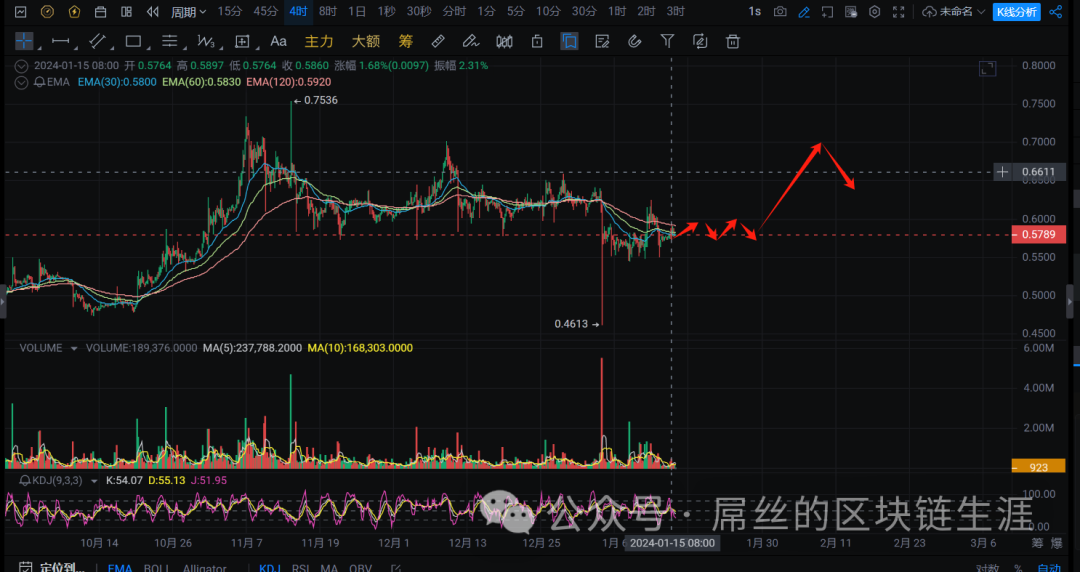
瑞波,xrp 日线目前是低位盘整,4小时看,由于三线交叉,变盘方向快来了,因为之前没有怎么涨过,我认为这波上涨力度可能不错,建议短期去持有一下,这波上涨会跟着BTC一起涨,所以耐心等待就行了,形态上是震荡,1小时线看,目前0.578附近一直在横盘,由于量能持续萎缩,估计快拉盘了,我的建议是:可上多单,高度可看0.7附近。
以上所有建议,仅个人观点,不构成投资建议,币圈有风险,操作需谨慎
需要进群的小伙伴可以添加助理微信


免责声明:本文章仅代表作者个人观点,不代表本平台的立场和观点。本文章仅供信息分享,不构成对任何人的任何投资建议。用户与作者之间的任何争议,与本平台无关。如网页中刊载的文章或图片涉及侵权,请提供相关的权利证明和身份证明发送邮件到support@aicoin.com,本平台相关工作人员将会进行核查。