点击观看视频:师爷陈1.12视频:大盘看空形态已成立?注意深跌五位数风险!
那今天的视频当中我们就来聊一聊比特币有可能会大跌1万美元 当然我个人目前手上的多头利润还是在持有 只是在近期一直做短线的合约交易来和现货做风险对冲 那比特币如果真的下跌的话 在哪里还有一百倍继续做多的位置

我们先来看一下比特币的日线级别 感觉在这里是有一个非常明显的看跌楔形的形态 或者是比特币已经是连续三天 包括昨天晚上美国的比特币ETF已经上市 但是昨天又是无功而返 48000依旧是没有企稳 那么在这个位置我们就要怀疑 如果这边真的是一个看跌楔形的形态
那么有可能就会是主力故意在fomo整个市场 或者是拉热度和欺骗散户 而且我们可以观察一下下方的成交量 量这么大 但是48000最终来看的话截止到现在都还没有站上 那等下我会跟大家讲 有可能比特币会下跌一万美元 我是从这个49000开始计算的
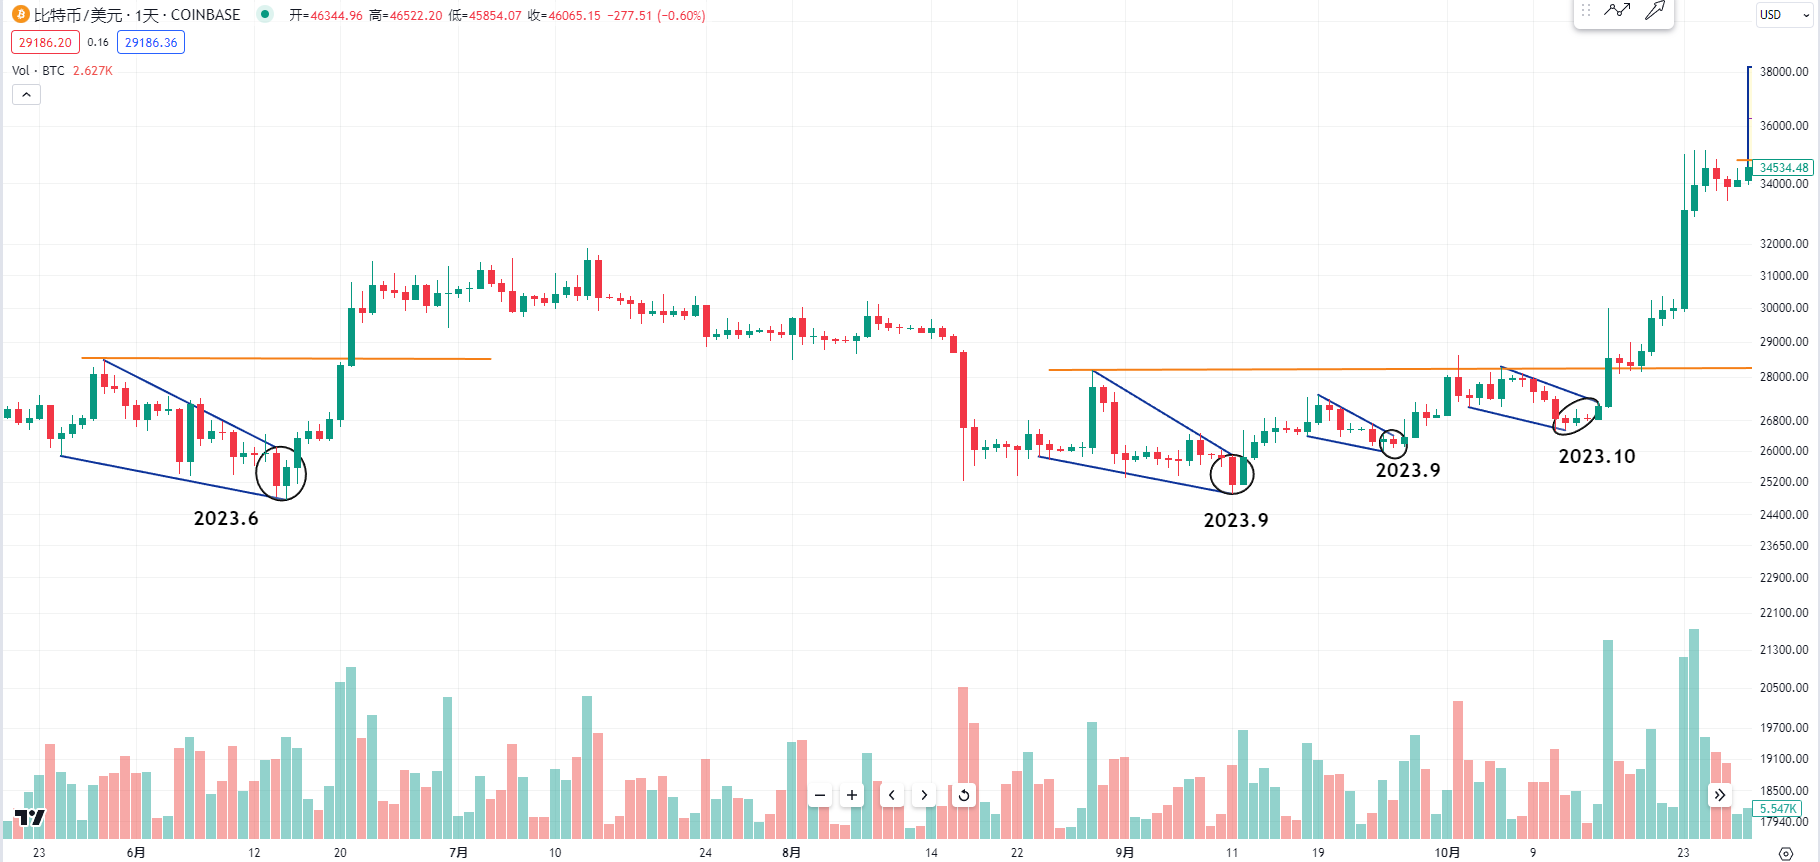
那我们来看一下比特币在2023年的十月份 当时在低点的位置 包括十月份 或者是这边的9月份 我也是讲过有可能在这里庄家是在故意打压从而骗散户卖在低点的位置 我们可以看一下他好像每一次反弹的高度都不够充分 然后低点也是在不断的降低
有可能就是主力在故意在打压制造陷阱 让散户的筹码卖在低点的位置 然后主力全部买走 那在形态学理论里面 看涨的楔形或者是看跌楔形也都是在往期的视频当中有跟大家讲过 你如果能够卖在这些低点的位置 他至少都会突破楔形启动的位置 就是起跌的位置
我们可以观察一下包括在2023年6月份的时候 当时也是一样 就是主力在故意降低价格 然后低点的话也是不断的在降低 让很多散户都认为比特币要跌下去 其实这种形态就是主力刻意在吸筹码 或者是后面我们可以观察到 他也是会回到下跌启动的位置
那现在比特币现在涨上来为什么我还会说比特币可能要下跌一万美元 我的观点是如果目前的这个位置真的是一个看跌的形态 就是从最高点49000到这个低点 大约是在40000 而且我们配合蜡烛图的形态 像这种K线也是败像 高点灯芯超过实体的2倍
包括这几根k线也是说明了市场有可能在这个位置存在着多空分歧 当然也不排除他如果继续上去 也有可能化解这个楔形的形态 不过我们一定要留意 如果这个趋势线跌破 那我认为理论空间的目标至少要到这个40000低点的位置
所以跌一万美元就是从这个49000跌到40000附近 大约就是会超过9000美元的一个下跌 所以希望大家在这个位置一定要小心 那如果连40000这个位置都跌破的话 那我认为有可能我们真正下一步100倍做多的点位就是在40000美元的下方
那我们到时候就看看有没有机会去布局 或者我们可以看一下当时的这个区间 如果能够跌到这个区间 我们再去观察有没有一些低点的支撑 比如说在35000附近的这个支撑区也是非常的强

然后我们再观察一下历史 因为楔形的利润在历史上是屡试不爽 我记得比特币在2021年的5月份或者是3月份 当时在这个65000的高点也是有一个非常大的看空楔形的形态 就是他每一次高点都是在不断的在走高 然后回撤的低点都不够充分 整个形态就形成了一个夹角 最终在这个位置崩盘
我们可以看一下 他也是回到了这个启动的位置 或者是后面的这个位置再走了一个看空楔形的形态 然后最终下跌回到了这个低点 把这几个低点全部跌破 然后在2021年的5月份到7月份也是走了一个倒过来的看涨楔形的形态 后面他启动之后就会回到这个下跌启动的位置
所以现在大家如果要在合约里面追多的话 就要考虑比特币如果下跌10% 有没有这种可能性会被爆仓 所以目前这个位置尽量要小心 有可能做多的点位就是要看下方有没有低点的支撑区 我们到时候再观察可不可以100倍做多

然后我们再来聊一下 如果比特币跌不下来 那有没有可能会再涨上去 或者是时间这一块 我们观察一下这几天比特币从25000的底部涨到去年10月份的这个位置开始 我是有计算过
时间拉到这个位置是13天 就有一个转折向上 也是从这个位置时间拉到这根K线 他是21天转折向上 然后继续拉到这个位置 也是在34天斐波拉契数列转折向上 后面是55天在这个位置也是有一个短线的启动
那现在我们去观察一下 如果自然现象 斐波拉契数列有没有可能在89天 就是在1月22号有没有一个变盘点 就是我们在这个位置尽量观察比特币不能跌破短期的这个趋势线 那有没有可能会在89天会不会出现一个变盘向上的动作
当然前提之下我们要留意目前的这个位置不能被跌破 如果把这个低点给跌破 那么跌幅有可能就会超过一万美元 我们尽量还是要小心
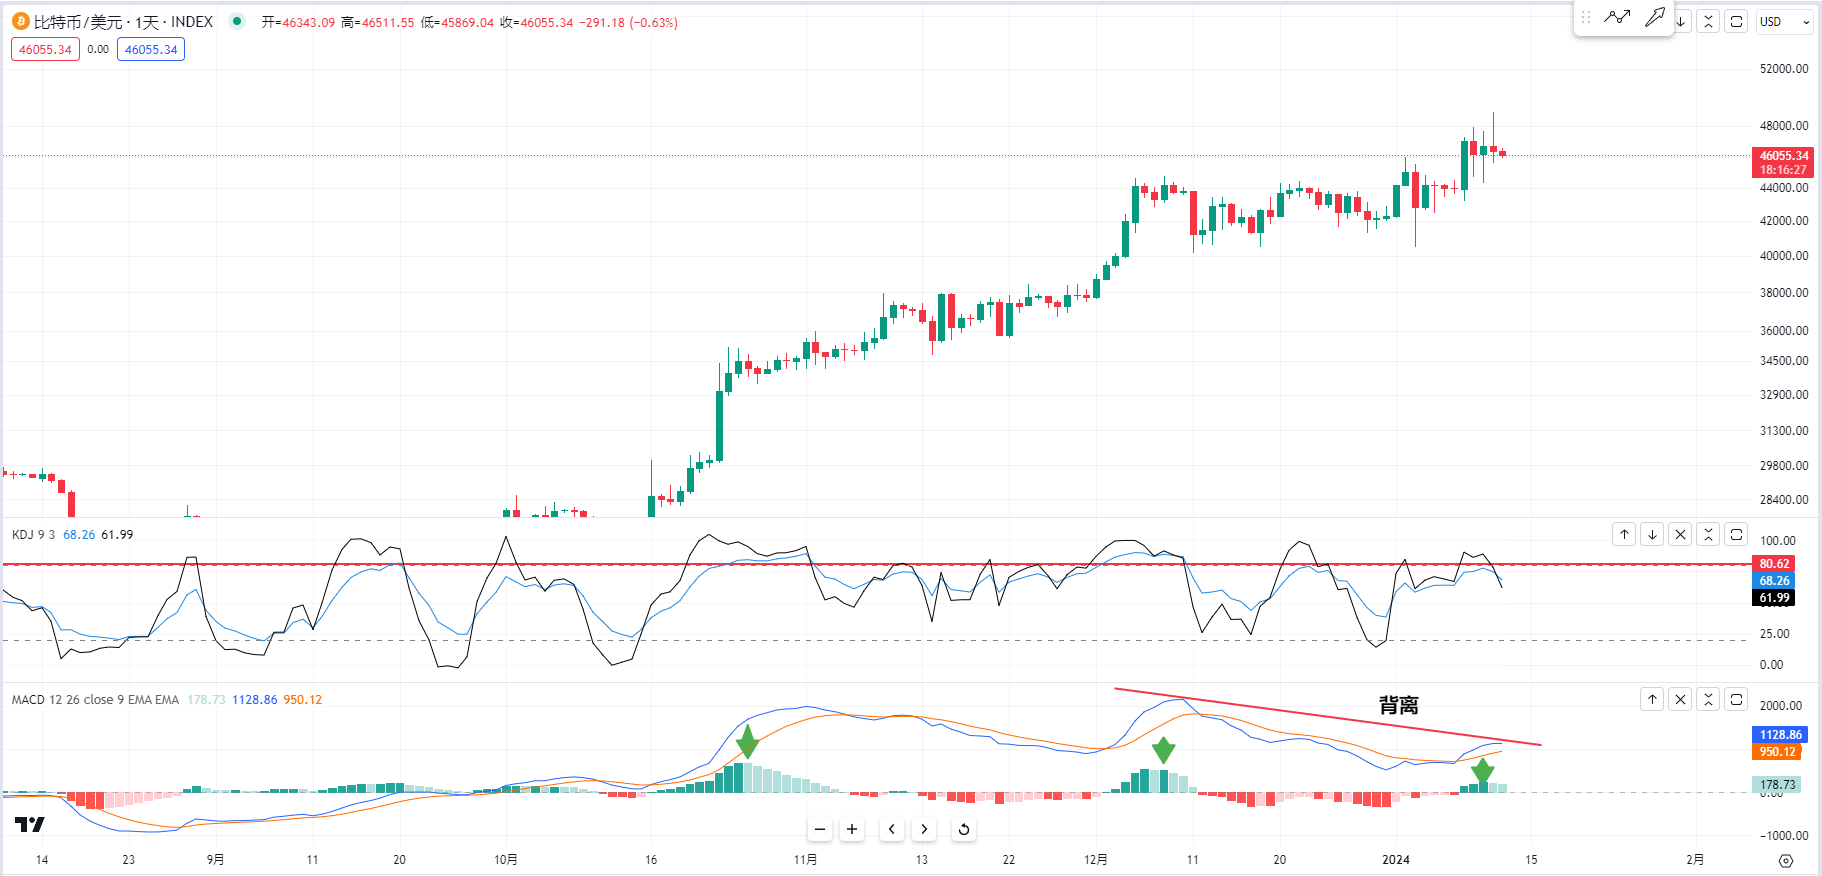
然后我们再来观察一下比特币日线的一些指标 因为该进入80的时候不进入 然后现在的kdj指标又形成了一个死叉 所以目前的kdj他不光是在背离 而且kd也是在死叉 或者是这个macd在日线里面也是有背离 而且他这个macd的柱状一个比一个更低 那既然有这种败像 那上涨的时候大家还是不能够去追多
更多策略可加实盘
K线为王,趋势为皇,我是师爷陈,专注BTC、ETH现货合约多年,没有100%的方法,只有100%的顺势而为;每日全网更新宏观面分析文章,技术面复盘分析视频。 温馨提示:本文只有专栏公众号(上图)是师爷陈所写,文章末尾及评论区其他广.告均与笔者本人无关!!请大家谨慎辨别真假,感谢阅读。
免责声明:本文章仅代表作者个人观点,不代表本平台的立场和观点。本文章仅供信息分享,不构成对任何人的任何投资建议。用户与作者之间的任何争议,与本平台无关。如网页中刊载的文章或图片涉及侵权,请提供相关的权利证明和身份证明发送邮件到support@aicoin.com,本平台相关工作人员将会进行核查。


