Click to watch the video: Master Chen 1.5 Video: Will the Launch of Bitcoin Spot ETF Really Be Bullish? Pay Attention to the Risk of Market Downturn!
Today, let's talk about the possible upcoming launch of the Bitcoin spot ETF in the United States. Will Bitcoin continue to rise? I remember that four months ago, Bitcoin dropped to a low of 25,000. At that time, the spot ETF was listed in Amsterdam. I also mentioned in the article that the significance of this listing is very significant. Long and medium-term positions can be taken in Bitcoin. Now, Bitcoin has risen by about 100 times. Today, I will share some knowledge about Bitcoin charts and my views on whether Bitcoin will continue to rise.

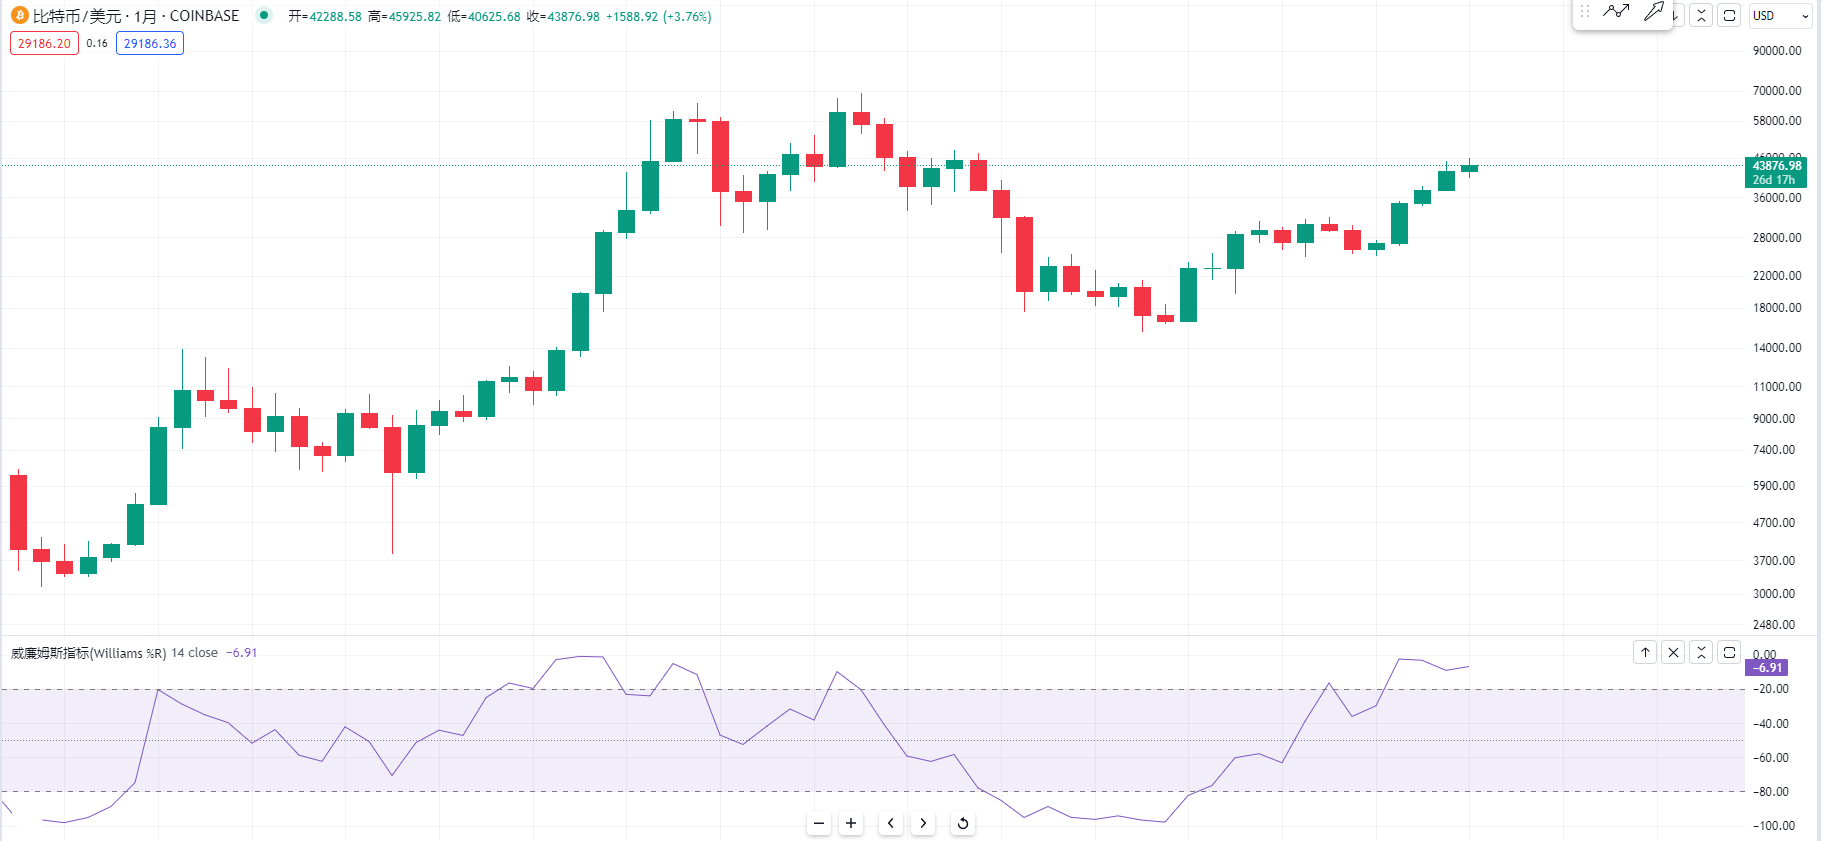
First, let's take a look at the daily chart of Bitcoin. These days, I have mentioned that I am currently hedging Bitcoin spot with short-term contracts at the high point of the bearish butterfly D point. This is because the main force is very bearish at this position. We can also see that I mentioned a bullish butterfly pattern around 25,000 at the bottom, or after it rose to 26,000, I also mentioned a bullish Gartley pattern for Bitcoin. In addition, in conjunction with the listing of the first stock exchange for Bitcoin ETF globally, I also mentioned in the article that this is of great significance. It is possible that the main force was harvesting chips at the bottom of 25,000.
I also mentioned in the article that there is a deep connection between the Netherlands and Wall Street. Without the Dutch, there would be no current New York. Since then, in the past four months, Bitcoin has risen by 100 times. I have also told everyone that it is possible for the main force to reverse its operations. A favorable position at a high point may not necessarily be favorable, and an unfavorable position at a low point may not necessarily be unfavorable.
Recently, the Bitcoin spot ETF in the United States is likely to be listed soon. The news in these days is also widespread, including the mention in my article that the Wood Sister Bitcoin spot ETF has also submitted a securities registration application to the SEC, and Grayscale has also submitted a securities registration application for the Bitcoin spot ETF to the SEC. Even a legendary investment company, Fidelity, has submitted a securities registration application for the Bitcoin spot ETF.
So, my view is that it is not ruled out that the Bitcoin spot ETF may be listed on the US stock exchange in the next one or two weeks. But my view remains the same. We should observe the space as much as possible. The main force is very cunning. I have mentioned before that we should observe the high points of the space as much as possible. A favorable position at a high point may not necessarily be favorable. Moreover, in these days, near the 46,000 bearish butterfly D point, or yesterday's rise, the trading volume has actually shrunk a bit, and then there was volume during the decline. So, at this position, we should still observe whether Bitcoin will continue to be in a box range and also guard against the possibility of the main force of Bitcoin operating in reverse. It is possible that the main force of Bitcoin had already bought a lot of spot positions during the listing in Amsterdam, and now, at this high point, there may be a possibility of washing the market in the short term, or even the possibility of rising again after a decline.

Today, let's share the Williams indicator of the monthly chart level of Bitcoin. Why we should be cautious at this position is because of historical experience. The indicator has come to a very low position in 4 years. In 2019, at the bottom, or in 2022, the indicator came to 80. In 2019, it also came to 80. When it's time to buy, you should buy. In positions like this, you may have to wait 3 to 4 years for a chance. We can also take a look at the bottom of Bitcoin in 2015. The Williams indicator was also below 80. But recently, there is a problem. We can see that the current range is also in this overbought range. So, we should observe the position of Bitcoin in history, such as the position in 2019, when the Williams indicator came to around 20, or the current Williams indicator is also in a very overheated range.
So, we should observe the position of Bitcoin in 2021, which is also in a relatively overbought range, or when it enters a bear market later. But at this position, my view is that Bitcoin is about to enter the halving time. At this overheated position, we need to be cautious. For example, historically, at several positions in 2015, when it was about to halve, there was a big drop. We can take a look at the previous several waves of rise. When Bitcoin reached a high point, the Williams indicator came to around 20, which is also an overheated range. Or after the halving, let's take a look at the rise inside. If you see this kind of situation in the monthly chart level, especially when the Williams indicator comes to around 0 or 20, we need to be cautious about whether there might be a retracement of more than 20% to 30%. You need to observe whether the Williams indicator may return to around 20. These positions are very important buying points. So, my view is that we should observe the current Williams indicator of Bitcoin. We should try to observe whether it will come to around 20 in the next step, which is similar to several positions in 2015. Returning to around 20 may be the real buying point for the next 100 times long position.
Moreover, we can observe that when Bitcoin rises to this position, the candlestick seems to be getting smaller as it rises. So, it is possible that it may not necessarily continue to rise at this position. I believe we should be cautious and observe whether Bitcoin may operate in reverse using favorable news. Will there be a medium-term level of washing the market, or will there be a low point of retracement? We will look for long positions at that time.

Then, let's take a look at the box range of the daily chart of Bitcoin. It has been a while. My view at the moment is that we should still observe the high points in the front, around 44.4K, or yesterday, when it came to this position and encountered some pressure and couldn't go up. If you want to trade, you can look for high selling and low buying positions in the box range. But in a range like this, the profit may not be much, or it is possible that there may be another 1 to 2 months of box consolidation at this position. What we need to guard against is whether Bitcoin may have a position that may be a medium-term buying point.
For more strategies, you can join the live trading.
Candlestick is king, trend is emperor. I am Master Chen, focusing on BTC, ETH spot contracts for many years. There is no 100% method, only 100% follow the trend. Daily macro analysis articles and technical analysis review videos are updated on the entire network. ImageFriendly reminder: This article is only written by Master Chen in the official account (as shown in the picture above). The advertisements at the end of the article and in the comments section are not related to the author. Please distinguish carefully between true and false. Thank you for reading.
免责声明:本文章仅代表作者个人观点,不代表本平台的立场和观点。本文章仅供信息分享,不构成对任何人的任何投资建议。用户与作者之间的任何争议,与本平台无关。如网页中刊载的文章或图片涉及侵权,请提供相关的权利证明和身份证明发送邮件到support@aicoin.com,本平台相关工作人员将会进行核查。


