Daily Sharing
After Bitcoin fell below 43,000 this morning, it quickly dipped to 42,500 and then rebounded. It is currently inclined to undergo a 4-hour pullback. However, if the pullback does not drop below 40,500, it may form a 4-hour consolidation and then choose a direction.
On January 10th, Wood Sister's Ark Fund applied for the final resolution of the Bitcoin spot ETF, with only two expected options: approval or rejection. Regardless of the final result, it will cause a huge shock to the market. Based on the current market trend, Bitcoin may have difficulty rising significantly before this event, and it may also have difficulty in a significant decline, mainly oscillating on the 4-hour chart, or possibly creating a new high on the daily chart.
BTC
Due to the rapid changes in the market, this article can only make predictions based on the market conditions at the time of publication. Short-term players should pay attention to the latest market changes and use this information as a reference only.
1H:
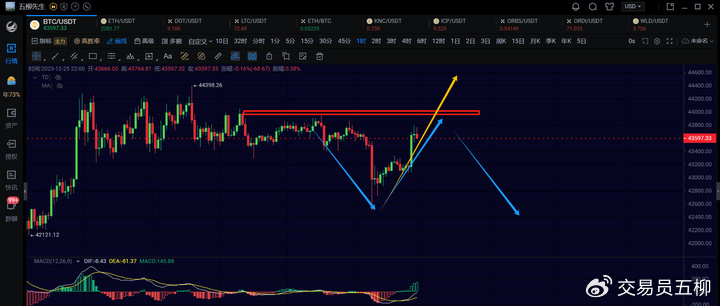
The 1-hour chart is currently not very clear. Bitcoin's immediate focus is on whether it can break through 44,000. If it does, the rebound on the 4-hour chart will continue. If it does not break through, there may be another downward movement. The short-term trend is not very certain.
Bitcoin's current situation is challenging for making profits, as it is difficult to obtain sustainability in both upward and downward movements. The main trading opportunities are currently in other altcoins. Bitcoin is likely to continue oscillating until the ETF is launched in January.
15M:

On the 15-minute chart, Bitcoin fell below the consolidation and then rebounded back into it. It is currently inclined to rebound on the 1-hour chart. Pay attention to whether it can break through 44,000 again. If it does, there is a high probability of breaking through 44,400 to extend the 4-hour rebound. If it does not break through 44,000, be aware that it may fall back to 42,500 again.
ETH
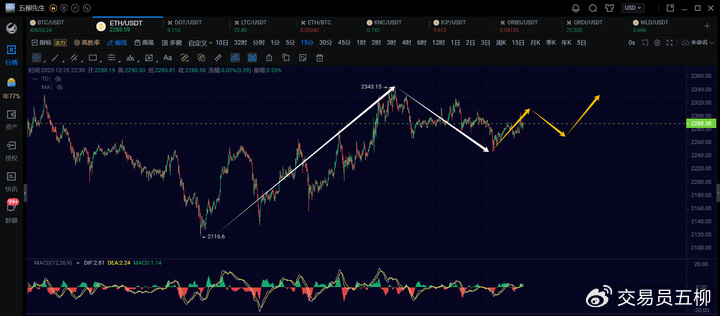
Ethereum currently appears to be undergoing a 1-hour rebound, and is currently in the second 15-minute pullback. If it does not drop below 2,260, there will be a third 15-minute rebound. Pay attention to the resistance near 2,340.
Trend Direction
Weekly Chart: Upward trend, currently continuing the rebound from 15,476, pay attention to the subsequent daily chart for when it may end.
Daily Chart: Upward trend, likely to continue extending. If there is a daily pullback, the price needs to drop below 40,500.
4-hour Chart: Downward trend, breaking through 44,000 will extend the 4-hour rebound, otherwise it may still be in the process of a 4-hour pullback.
1-hour Chart: Upward trend, after falling below the consolidation, it returned back into the consolidation, indicating a possible 1-hour rebound in the short term.
15-minute Chart: Upward trend
Feel free to follow my public account for discussions and exchanges:

The article is time-sensitive, so be cautious of risks. The above is only personal advice and is for reference only!
免责声明:本文章仅代表作者个人观点,不代表本平台的立场和观点。本文章仅供信息分享,不构成对任何人的任何投资建议。用户与作者之间的任何争议,与本平台无关。如网页中刊载的文章或图片涉及侵权,请提供相关的权利证明和身份证明发送邮件到support@aicoin.com,本平台相关工作人员将会进行核查。


