【关于BTC/ETH现货ETF相关报道】
1、穆迪分析公司高级总监Yiannis Giokas表示,近期比特币价格飙升背后的最大驱动力可能是比特币现货ETF的申请数量增加,预计将于明年1月获得SEC批准。
2、原 SEC 官员、比特币批判者 John Reed Stark 表示,“SEC 有 90% 可能性批准比特币现货 ETF”的观点是荒谬的;有无数的立案案件和正在进行的非公开调查,意味着比特币现货 ETF 的批准将对投资者构成严重威胁。
3、美国证券交易委员会(SEC) 推迟对灰度将其以太坊信托转换为以太坊现货 ETF 的申请作出决议,将对拟议基金的决定期限延长 45 天,至 2024 年 1 月 25 日。
4、Coinbase 首席执行官Brian Armstrong 表示,比特币可能是扩展西方文明的关键,法币将继续通胀,直到失去作为货币的优势。
【BTC今日分析】
日图,从均线角度看,BTC从我们27200介入以来尚未跌破过30日生命线,并且终于迎来了短期均线的再次金叉加速上涨形态。
MACD也迎来了指标修复完成,在归零轴后再次金叉同均线形成金叉共振,日图依然表现出强势走势。
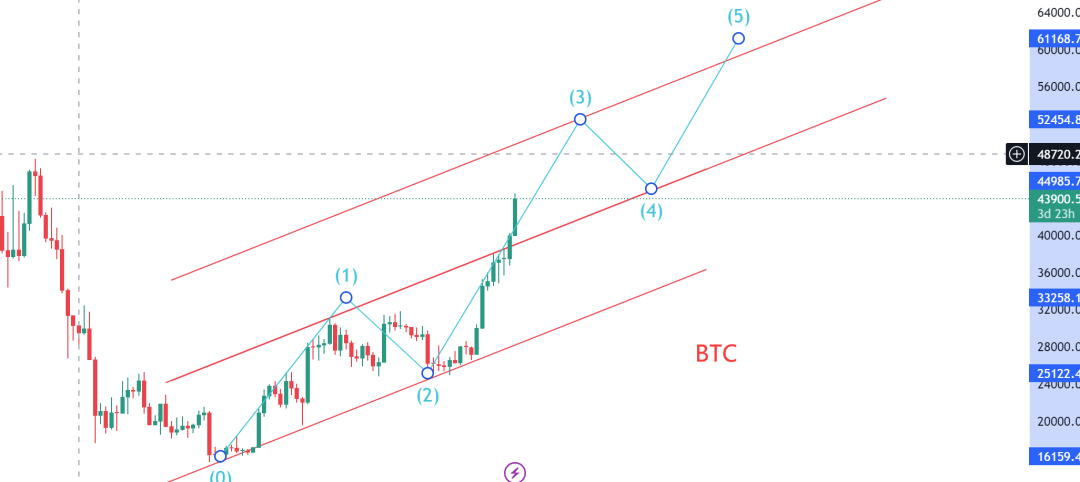
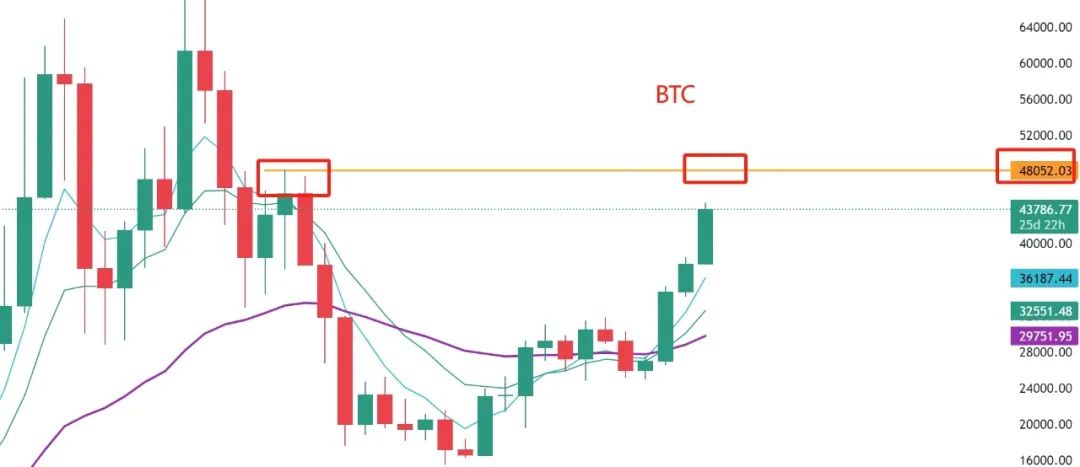
BTC近期冲高至44488U,距离48000美金一步之遥,自从突破了上涨通道上轨38000美金之后,比特币再次开启了新的上涨行情,从浪形角度看也是三浪形态。
小时图,我们需要关注比特币在43600U附近的支撑企稳情况,跌破还将进一步下探,若企稳上攻站上44000上方则可能会有一波新走势,从12月1日至今比特币小时图生命线是BTC的趋势线。
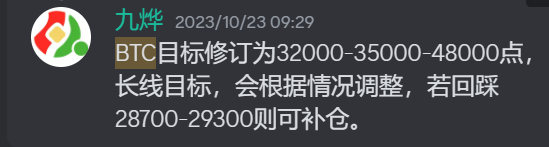
在27200启动之后,10月23日,我们根据比特币实际走势将目标进行了如下调整:分别为32000-35000-48000点,目前已经触及到4500点附近,同时突破38000点后开启新一浪的走势(3浪),日图MACD指标修复完成,九哥认为多头依然会保持强劲态势,直到达到预期目标48000以及通道上轨51000附近区域。
【时隔4年BTC再次突破】
月图,BTC11月月线收线了37700U,上涨趋势是毋庸置疑的,也不要幻想再次回踩到30000点以下,至少现在不要有任何想法。
比特币月线一阳穿三,均线系统呈现了多头排列,MACD线也逐渐开始上穿零轴,KDJ再次掉头向上,这些指标分析工具,也再一次验证了比特币趋势已到的观点,现在就是牛市的初期阶段。
回顾比特币币近十年的价格行走轨迹,对未来价格走势有一定的预判作用。2015年11月比特币价格站上30月线,之后比特币再也没有跌破过30月线,沿着5月线上攻直至2017年的峰值20000点,当时比特币从400点上涨到20000点,这是50倍的上涨。
2019年4月份比特币也出现了一样穿三上穿30月均线,之后价格沿着30月线从4000点用了2年时间上攻到69000点,上涨了11倍。
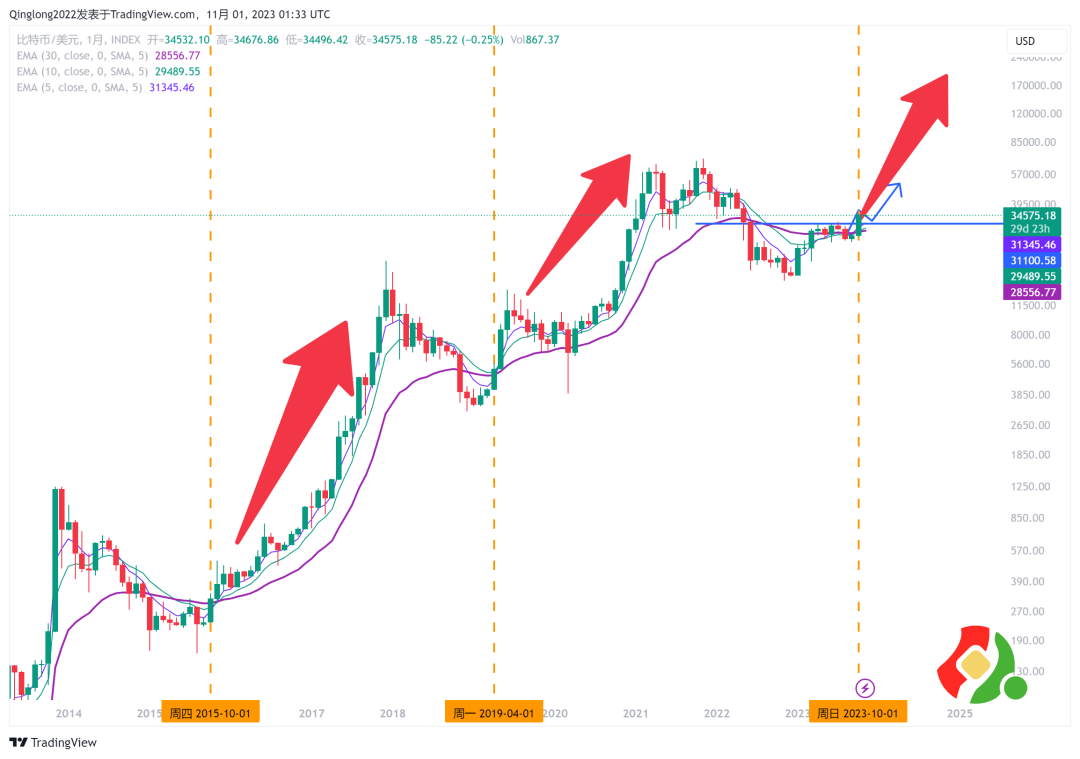
时隔4年过后比特币再次迎来了月线一阳穿三的走势图,比特币现在处在牛市初期,而且是真正的初期。
历史虽然不会重复,但一定会重演,只是版本不同,人物不同,故事也不一样。
【ETH走势分析】
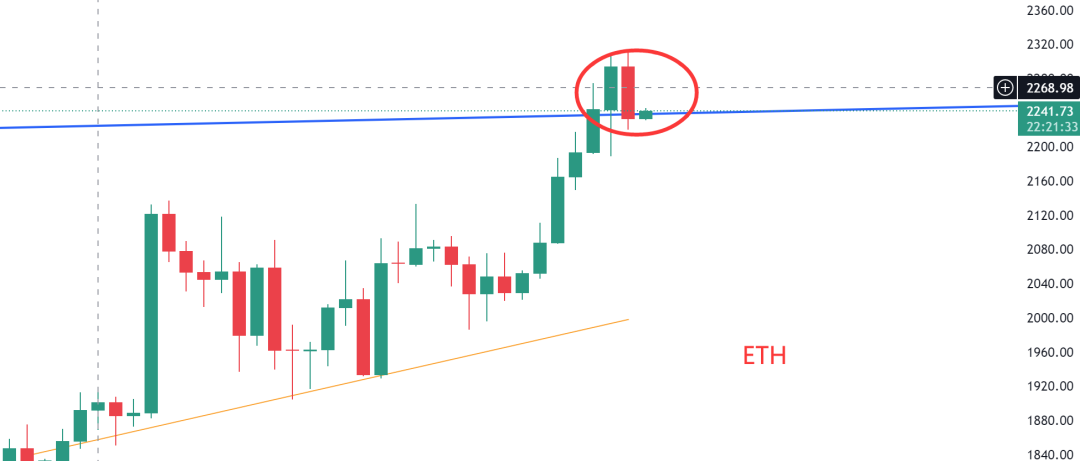
日图,ETH价格多次回调30日均线之后又开始拉升走强,整体上ETH走收敛三角形态。ETH选择了向上突破上轨,并且创今年以来的新高2300U,下个目标位2450.
日内我们需要关注ETH能否再次收回2260U,这个很关键;昨天和前天的K线有看跌的形态,密切关注,下个支撑2190U。
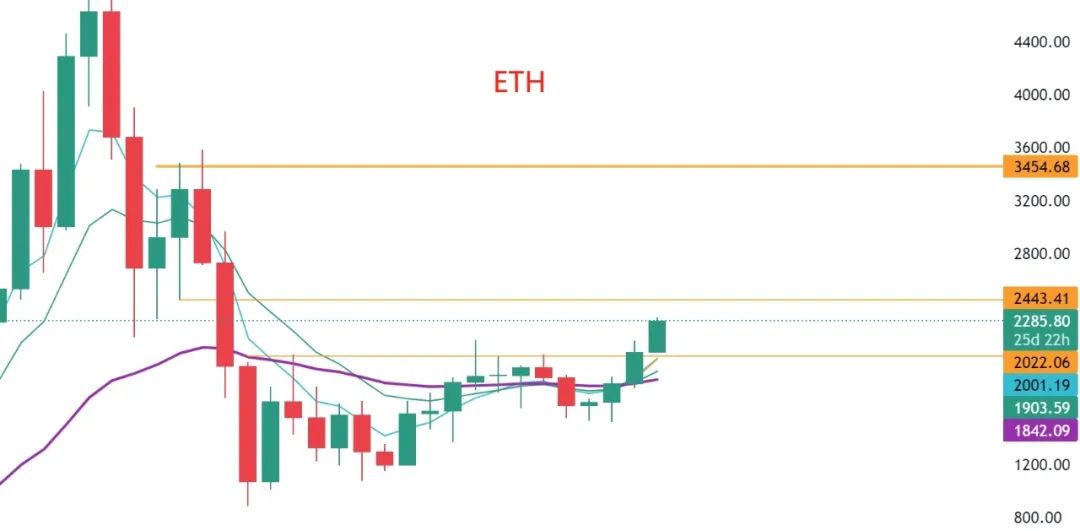
周图,ETH均线已确认形成金三角形态,强势上涨信号,上周完成1880U的回踩任务,本周大概率就是继续破新高了。
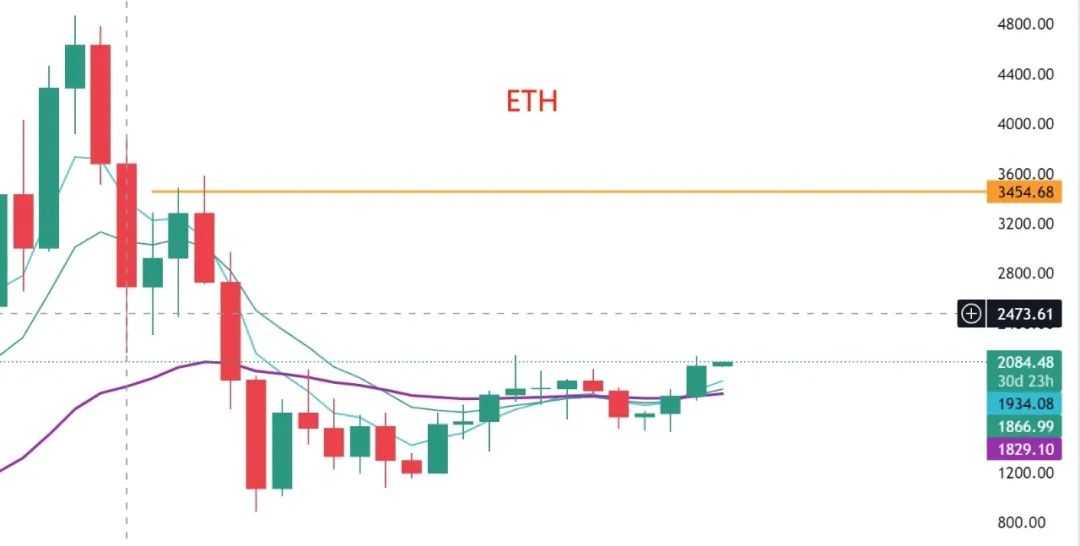
月图,12月-次年1月极有可能是ETH领涨,均线系统也已经呈现了多头排列,MACD指标在金叉过后也开始上穿零轴,KDJ也是处在金叉形态,这些都是ETH月图走势强势的价格表现,我们前期1626U入局的ETH拿好了,唯一的风险就是你拿不住。
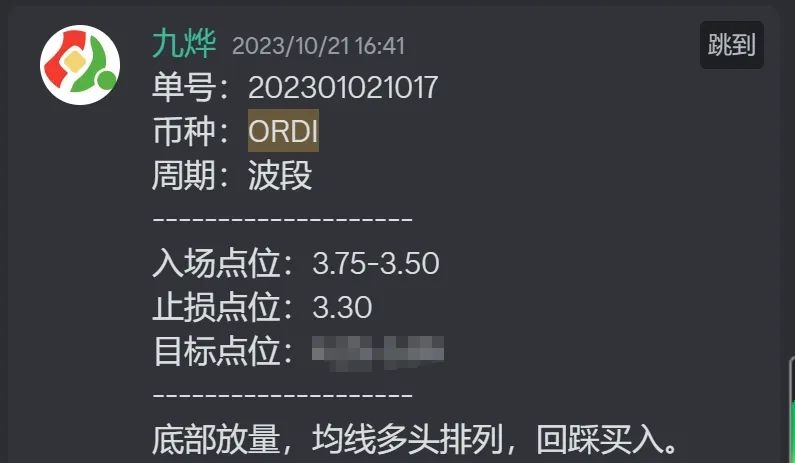
【ORDI走势分析】
ORDI,作为比特币生态中的铭文龙头代币,从3.75的成本入场至今已经超过10倍达到1759.20%的收益率,最高触及69.72U,
昨天K线图为中阴线并且带有较长的上下影线,同时放量,这就是主力有出货的迹象,在55-60U区间可以考虑再次减仓。
该币种总量2100万枚,从目前来看尚没有停止上涨的意思。铭文赛道让比特币走向深蓝。
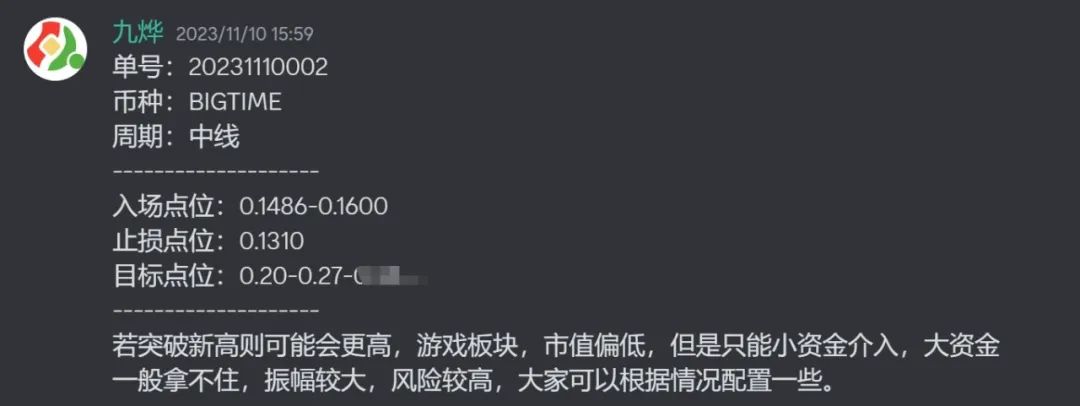
【BIGTIME 走势分析】
Bigtime 作为链游龙头代币,从0.17U附近入场,至今已经达到518%的上涨幅度,并且创历史新高0.99U。
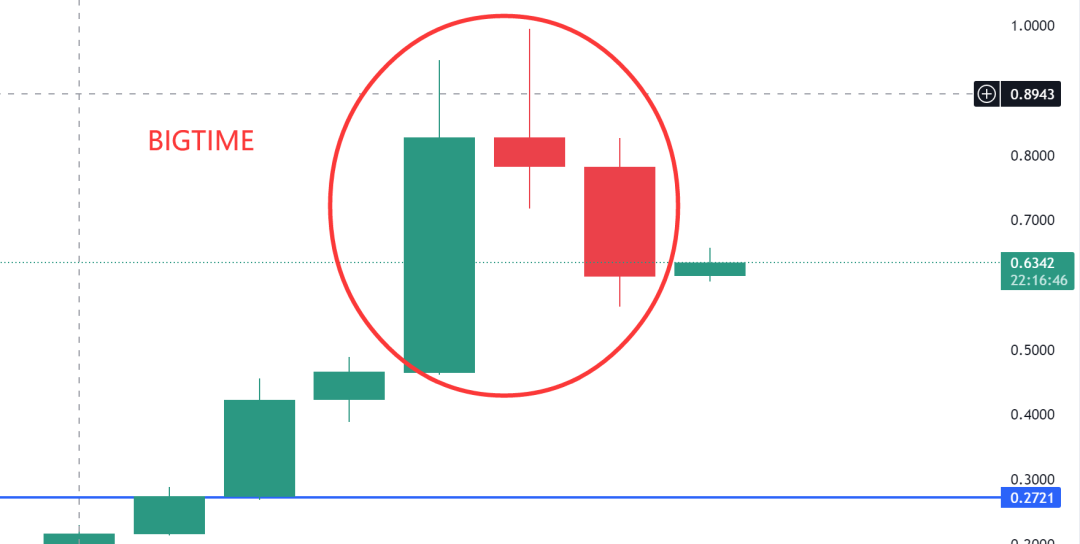
日图昨天收中阴线,并且收盘价在前天阳线实体中位线之下,可以理解为黄昏之星,反弹0.70-0.65止盈离场或者减仓。
【九哥语录】
1、K线语言是一种结果,无论我们知道的还是我们不知道的,无论是正在发生的还是将来要发生的,都会体现在K线语言当中。
2、上涨就是上涨最好的理由,下跌就是下跌最好的了理由。
趋势已来,不要想着暴跌也不要想着背后什么原因,K线告诉了我们一切。随着时间的验证和价格的不断攀升,会告诉我们答案。
3、趋势一旦形成是不会轻易改变的,你只需要顺势而为,忽视一切外部消息,专注于K线语言,专注于交易系统,其他都是干扰。
4、在趋势形成之后,唯一的风险就是拿不住。
免责声明:本文章仅代表作者个人观点,不代表本平台的立场和观点。本文章仅供信息分享,不构成对任何人的任何投资建议。用户与作者之间的任何争议,与本平台无关。如网页中刊载的文章或图片涉及侵权,请提供相关的权利证明和身份证明发送邮件到support@aicoin.com,本平台相关工作人员将会进行核查。


