[Latest Developments in Bitcoin ETF]
1. Bloomberg analyst James Seyffart wrote that the speculation on spot Bitcoin ETF has pushed the asset size of ProShares Bitcoin Strategy ETF (BITO) to a historical high, approaching $1.5 billion.
2. Swiss asset management company Pando Asset has applied for a spot Bitcoin ETF in the United States and submitted the S-1 form to the SEC.
3. BlackRock met with the SEC's Division of Trading and Markets again yesterday to discuss the design mechanism of the spot Bitcoin ETF and presented them with a "revised" physical model design based on the staff's suggestions at the November 20 meeting.
4. Galaxy Digital founder Michael Novogratz predicted that with the approval of spot ETF, Bitcoin will reach a historical high, especially against the backdrop of the Fed's interest rate cut cycle, with potential investments in the first year reaching as high as $10 billion.
5. SEC Chairman Gary Gensler remained silent on the review process of spot Bitcoin ETF at the Health Market Association meeting, refusing to "prejudge."
Summary: Bloomberg Intelligence analysts stated that the SEC is expected to approve the spot Bitcoin ETF by January 10.
[Federal Reserve Officials Turn Hawkish Again]
1. Daly stated that there is currently no consideration of interest rate cuts, and it is too early to judge whether the Fed has ended its rate hikes.
2. Williams stated that the Fed's interest rate target has reached or is close to its peak. If inflation pressures persist, the Fed may raise rates again. It is expected that the inflation rate will decrease to 3% this year, 2.25% in 2024, and close to 2% in 2025.
[BTC Analysis Today]
On the daily chart, BTC has been suppressed by the upper boundary of a long-term uptrend channel. With the existence of the channel slope, the price of BTC is between 38,000 and 38,600 US dollars. In theory, this position requires a deep retracement, which will not change the upward trend. After the retracement, it is reasonable to gather strength for another upward push to break through the upper boundary of the channel.
From the current price trend and technical indicators of Bitcoin, the indicators are still in the process of recovery, and the bullish momentum has begun to weaken. There are two possibilities: one is a consolidation at a high level, waiting for corresponding bearish news to appear before breaking through and falling; the other is to use time to repair the indicators and market sentiment, and then welcome a new breakthrough.
Currently, with the appearance of Christmas in December, there is almost always a downturn in the market in December. I believe that even if there is an immediate rise, there will be a relatively large pullback in late December. The point of contention is whether to break through 38,600 first or to retrace first.
On the 6-hour chart, the upper boundary of the rising wedge is at 38,450 US dollars, and the lower boundary support level is at 37,000 US dollars. Breaking through either side will present new trading opportunities.
[BTC Phase Target Adjustment Recommendation]
After the start at 27,200, on October 23, we adjusted the targets based on the actual trend of Bitcoin as follows: 32000-35000-48000 points. The 35,000 point level has already been reached, and the 36,000 point level has also been broken through, reaching a high of 38,000 points. The current situation is a pullback after the breakthrough. The daily chart needs to adjust and repair the indicators. I believe that the adjustment of the bullish trend is for a better upward push.
[Trend Analysis: BTC Breaks Through Again After 4 Years]
On the monthly chart, BTC's November monthly closing price was 37,700 US dollars, and the upward trend is undeniable. There is no need to imagine that Bitcoin will fall below 30,000 points again, at least not now.
Bitcoin's monthly chart shows a single candlestick breaking through the three moving averages, and the moving average system presents a bullish alignment. The MACD line has gradually started to cross above the zero axis, and the KDJ has also turned upwards again. These technical indicators once again confirm the view that Bitcoin's trend has arrived, and it is now in the early stage of a bull market.
Looking back at Bitcoin's price trajectory over the past decade, it has a certain predictive effect on future price trends. In November 2015, Bitcoin's price broke through the 30-month moving average, and since then, Bitcoin has not fallen below the 30-month moving average. It surged along the 5-month moving average to a peak of 20,000 points in 2017, rising from 400 points to 20,000 points, a 50-fold increase.
In April 2019, Bitcoin also broke through the three moving averages, and then the price surged along the 30-month moving average from 4,000 points to 69,000 points in 2 years, an 11-fold increase.
After 4 years, Bitcoin has once again seen a single candlestick breaking through the three moving averages on the monthly chart, indicating that Bitcoin is now in the early stage of a bull market, and it is truly the beginning.
Although history does not repeat itself, it will certainly rhyme, just with different versions, characters, and stories.
[ETH Market Analysis]
On the daily chart, after multiple retracements to the 30-day moving average, ETH has started to rise again. Overall, ETH is in a converging triangle pattern, with the upper boundary at 2080 US dollars and the lower boundary at 1980 US dollars. We do not need to pay attention to the oscillation in the middle, as a breakthrough in either direction will create trading opportunities. Patience is required.
On the weekly chart, ETH's moving averages have confirmed the formation of a golden triangle pattern, signaling a strong upward trend. The 5-week moving average near 1880 US dollars has received effective support, and the price is still above 2050 US dollars. As long as this level is not broken, there is a possibility of further upward movement.
On the monthly chart, December to January next year is very likely to be a leading period for ETH. The moving average system has also presented a bullish alignment, and the MACD indicator has started to cross above the zero axis after the golden cross, while the KDJ is also in a golden cross pattern. These are all strong price performances for ETH on the monthly chart. For those who entered the market at around 1626 US dollars earlier, the only risk is whether you can hold on.
[LINK Trading Review and Analysis]
Today's analysis: On the daily chart, LINK has been moving in a converging triangle pattern, similar to ETH, with the upper boundary at 14.8 US dollars and the lower boundary at 13.6 US dollars. Patiently wait for a breakthrough. Add positions on an upward breakthrough and reduce positions on a downward breakthrough. Those who added positions at 14.2 US dollars in the spot market can still hold.
Spot Layout: After breaking through the oscillation range of over 500 days, LINK has experienced a brief adjustment trend and continues to rise. Based on LINK's trend, we have adjusted our trading plan since October 20, receiving support from the lifeline and starting a new uptrend.
At the same time, based on LINK's trend adjustment, we have adjusted our trading plan, entering the market at 7.6 US dollars and reaching the first and second targets, as well as adjusting the target levels. The current return rate is close to 100%. A breakthrough is only a matter of time; the question is whether you can hold on. You can take out the principal and leave the profits for the crazy period of the bull market.
Attached Image: LINK Trading Plan Tracking Path.
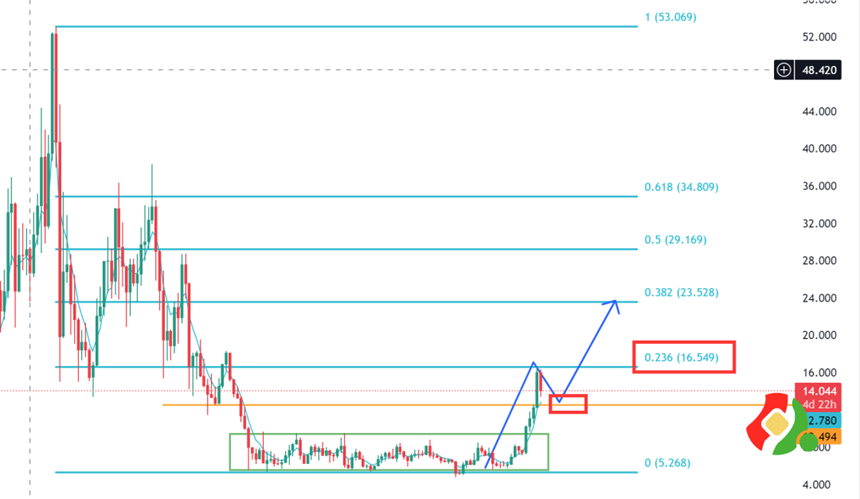
Trend Review: We found from the Fibonacci retracement from the recent low point to the start of the previous bull market that the highest rebound encountered resistance at 23.6% and experienced a normal technical retracement.
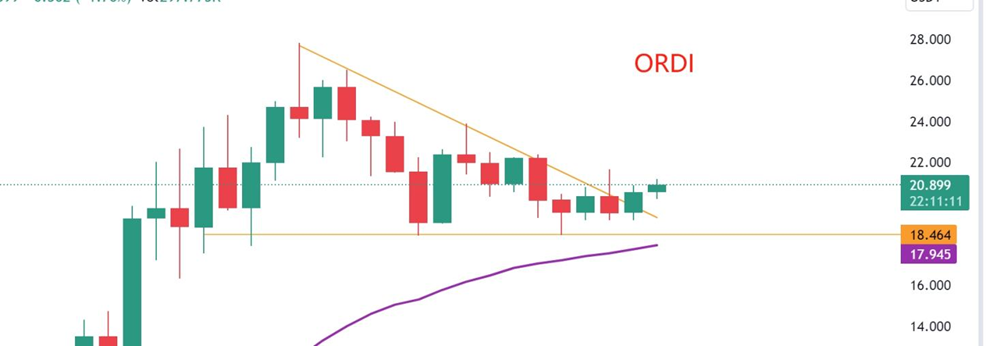
[ORDI Trading Review and Analysis]
Today's Analysis: On the daily chart, the candlestick combination pattern shows a bullish signal, and after consolidating near the lifeline for several days, ORDI has moved away from the descending triangle pattern. The support below ORDI is at 17.9 US dollars, and the upper resistance is at 22.4 US dollars. All of our current chips are in profit, with the lowest cost being 3.75 US dollars. Hold with confidence.
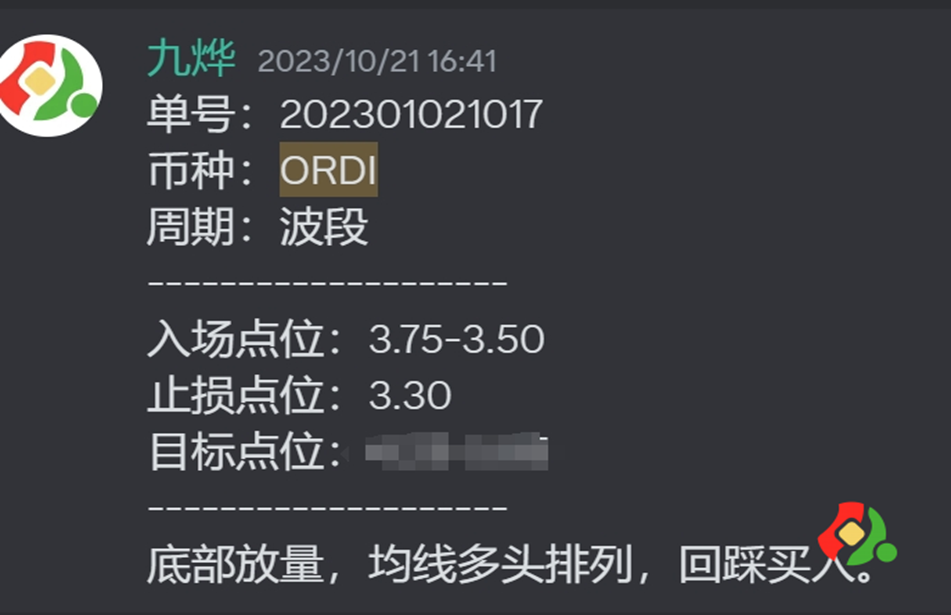
Spot Layout: Starting from October 21, when ORDI broke through the lifeline, it was clearly indicated to enter the market at 3.75-3.50 US dollars.
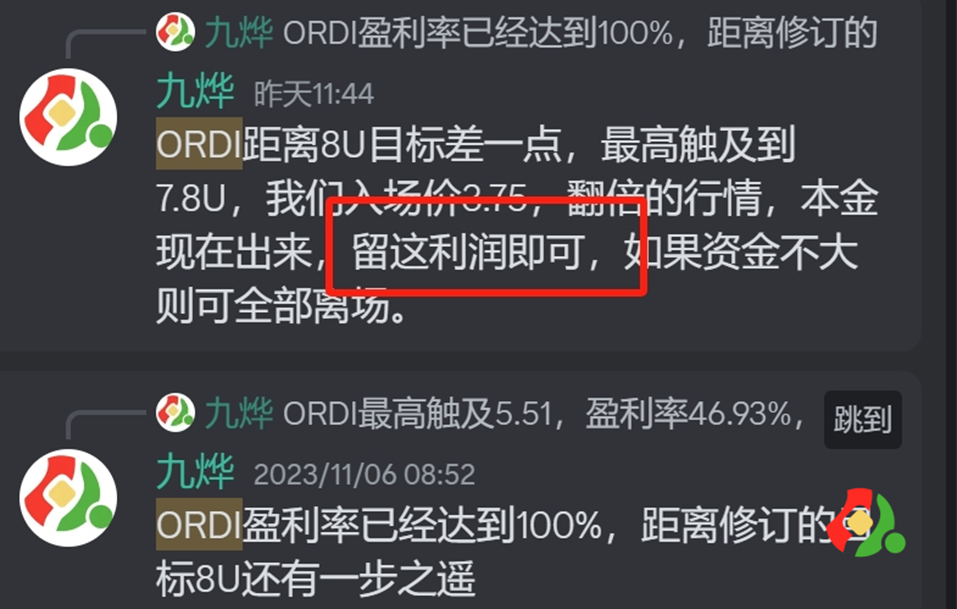
In the following period, ORDI surged violently, broke through the neckline at 4.25 US dollars, and adjusted the target to 8.07 US dollars. This area is a dense chip area, and profits have already exceeded 100%. It was suggested to exit with the principal, leaving the profits to soar.

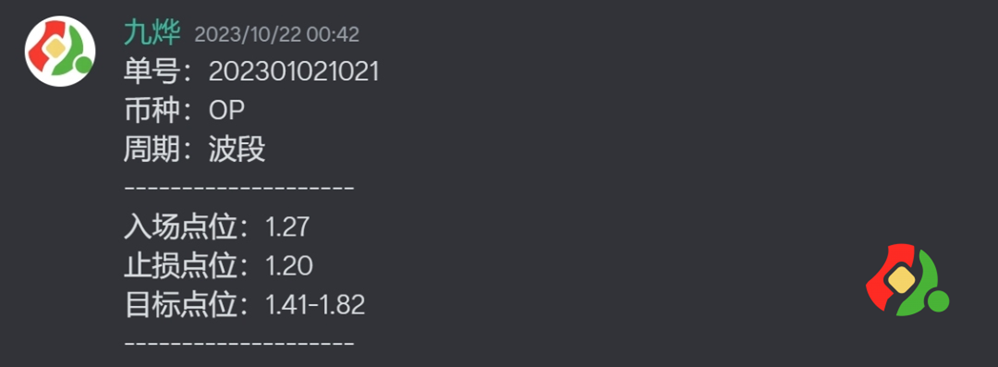
[OP Trading Review and Analysis]
Today's Analysis: As the leader of L2, OP has not shown an explosive upward trend, but with the strengthening of ETH, OP's price will have a good performance in December. The strong weekly resistance at 1.83 US dollars is the neckline. After breaking through, it will strengthen again. The support below is at 1.58 US dollars, and after multiple touches at this level, there have been strong rebounds. Hold patiently.
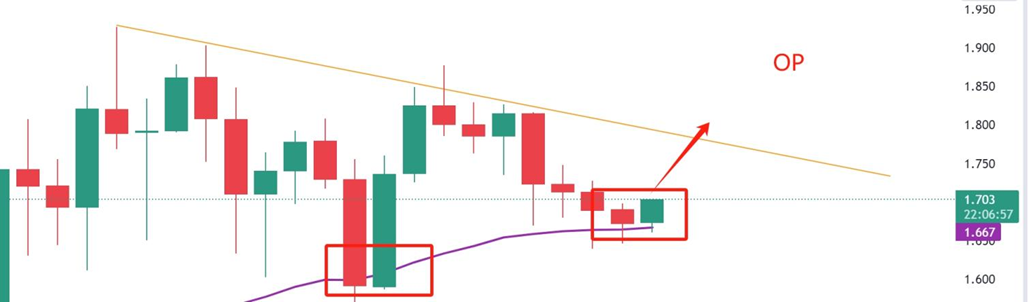
Spot Layout: In the article 202301021021, it was clearly mentioned that the entry point for OP is the bottom position. Add positions if it breaks through 1.42 US dollars, and it can still be added if it breaks through 1.83 US dollars.
However, the price has been oscillating and consolidating near 1.80, which means it has been oscillating near the weekly chart neckline, indicating a possible washout behavior. Pay attention to the breakout situation of OP after the market stabilizes.
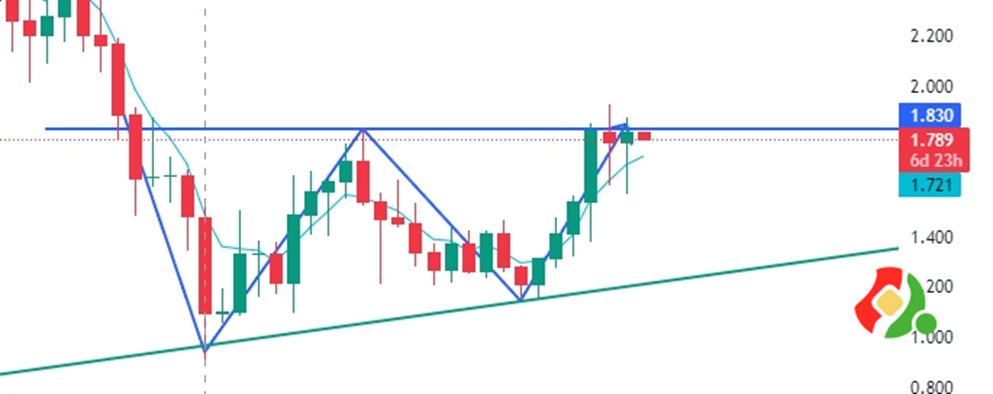
In the past two weeks, the long lower shadows on the weekly chart have not stabilized at 1.83 US dollars, and the daily chart reflects this more clearly, with a long period of consolidation around 1.83. At the same time, this area also signifies the importance of the weekly chart neckline. A breakout will lead to a larger upward space, with support at 1.73 US dollars.
[Position Adding Technique - Why Choose to Gradually Add Positions on Breakouts?]
Because we only do the right things.
Instead of adding positions on every retracement to obtain lower price chips?
If we buy a coin and the price does not move in the expected direction but moves in the opposite direction, it means we are wrong. At this point, triggering a stop loss and exiting is the right move, not adding positions to increase the risk.
Only when the price moves in the expected direction, indicating that we are right, can we consider re-entering on each breakout until the trend deteriorates and exit completely.
Let the profits soar for a while, don't be in a hurry to take profits and exit. If the trend emerges, persistence and holding are the best strategies, not being anxious every day, fearing that the profits will slip away!
[Quotes from Jiu Ge]
1. Candlestick language is a result, and everything we know or don't know, everything that is happening or will happen, will be reflected in the candlestick language.
2. The rise is the best reason for the rise, and the fall is the best reason for the fall.
The trend has arrived, don't think about a sharp decline or what the reasons are behind it. The candlestick tells us everything. With time verification and continuous price increases, the answers will be revealed.
3. Once the trend is formed, it will not change easily. You just need to follow the trend, ignore all external news, focus on the candlestick language, focus on the trading system, and ignore everything else as interference.
免责声明:本文章仅代表作者个人观点,不代表本平台的立场和观点。本文章仅供信息分享,不构成对任何人的任何投资建议。用户与作者之间的任何争议,与本平台无关。如网页中刊载的文章或图片涉及侵权,请提供相关的权利证明和身份证明发送邮件到support@aicoin.com,本平台相关工作人员将会进行核查。


