[Today's Fundamental Analysis]
1. According to the Wall Street Journal, the SEC is still searching for evidence to determine whether Binance and its founder CZ have control over a backdoor to access assets stored on the Binance US platform. The SEC filed a lawsuit against Binance and Binance US in June, accusing them of operating an illegal securities exchange, and the outcome of the lawsuit so far depends on the agency's concerns that Binance may have used fraudulent means similar to FTX to misappropriate US crypto assets. Reuters reported that a US federal judge stated that CZ must stay in the US temporarily until the Seattle court considers whether he should continue to stay there to attend the February 2023 judgment hearing or whether he should be allowed to return to the UAE.
2. Carrie Lam, the Chief Executive of the Hong Kong Special Administrative Region, responded to a virtual platform fraud case today. She emphasized the importance of government regulation to safeguard investor interests and combat unlicensed platforms. The Hong Kong Securities and Futures Commission website has listed 9 suspicious virtual currency investment platforms: HOUNAX, JPEX, Hong Kong Digital Research Institute, BitCuped, FUBT, futubit/futu-pro, EFSPD, OSL Trading, arrano. Network.
3. Tether has once again minted 1 billion USDT. After the minting, the whale "0x1dBb" received 61 million USDT from Tether Treasury. Since October 20th, this whale has received a total of 1.336 billion USDT from Tether Treasury and deposited it into exchanges.
4. Lin Chen, the Asia-Pacific Business Director of Deribit, tweeted that the futures contango for BTC and ETH on the Chicago Mercantile Exchange (CME) has reached 1.5%, approaching the levels seen during the bull market in March 2021. The market is indicating a high level of confidence in the approval of spot ETFs through its actions.
5. The price of Coinbase stock (COIN) briefly exceeded $121 yesterday, reaching a new high since May 22, 2022. COIN has risen by approximately 256.5% this year, but it is still down by about 65% from its historical high of nearly $343 on November 12, 2021.
6. According to on-chain data, the Bigtime token distribution address transferred 17.5 million BIGTIME tokens to 3 liquidity providers early today, with GSR Markets receiving 12.5 million, Amber Group receiving 2.5 million, and FBG Capital receiving 2.5 million.
7. Jito, a liquidity staking protocol on Solana, announced the launch of its governance token JTO and released details of an airdrop. The total airdrop amount for JTO is 100 million, with 90 million JTO distributed in this airdrop and 10 million JTO to be distributed next year. The airdrop snapshot was taken on November 25, 2023.
8. Currently, Binance has listed tokens for futures trading but not for spot trading, including KAS, BSV, PYTH, BONK, ORBS, BIGTIME, TOKENFI, and ETHW. This is a new phenomenon for recent listings on Binance. Analysis indicates that the core reason for this is that listing tokens for futures trading can earn fees without taking on excessive responsibility. Futures traders have a strong tolerance for price fluctuations, while spot traders may criticize the price drop after listing. It is also similar to the case of Blur, which listed futures for a long time before listing spot, testing the strength of the token after a long and short game. Additionally, listing futures is simpler than spot trading and does not involve issues such as token holding and technical matching. It is expected that Binance will continue to operate in a similar pattern in the future.
[BTC Market Analysis]
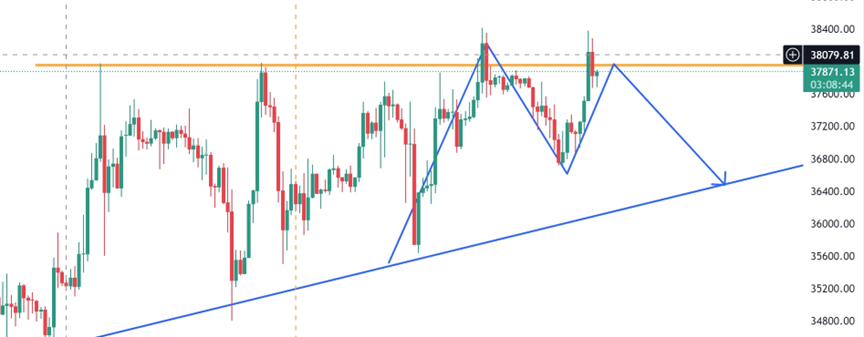
On the daily chart, BTC made a rapid upward move to 38,000 points yesterday but quickly fell back. This is the fourth time since November 9, November 15, and November 24 that it has attempted to break through 38,000 points. Whether it can truly break through this time remains to be seen. The volatility of BTC is decreasing, and the turning point is expected to occur in the next 1-2 days. If it can hold above 38,000 by the end of the month, the market can be expected to be positive in early December; otherwise, it may continue to retest or oscillate at high levels.
BTC rebounded from near 36,800U after hitting a low yesterday, coinciding with the 120-period moving average on the 4-hour chart, similar to the previous two rebounds. If there is an opportunity to rebound to near 38,000, consider reducing positions. The support levels below are still in the range of 36,800U-36,400U.
[BTC Phase Target Adjustment Recommendation]
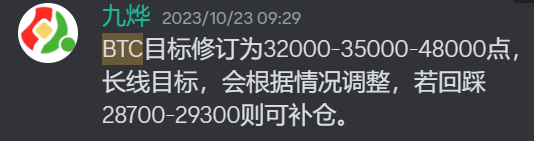
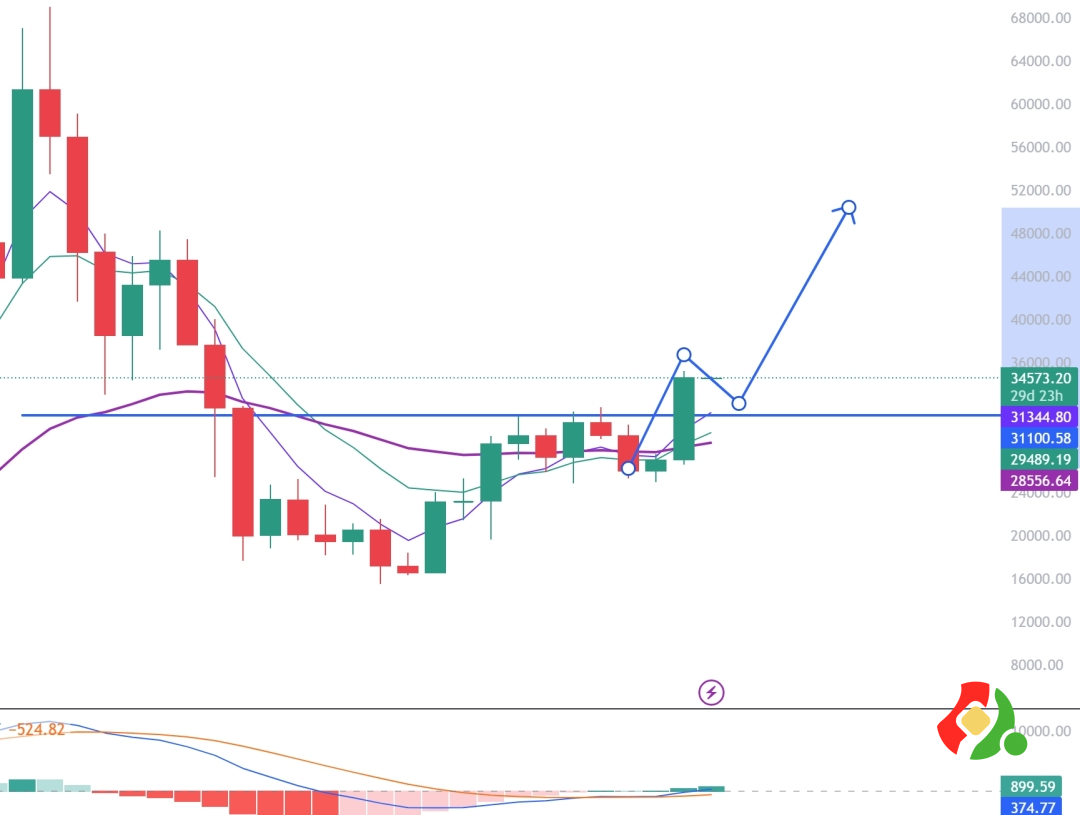
After the start at 27,200, on October 23, we adjusted the targets based on the actual trend of Bitcoin to 32,000-35,000-48,000 points. The price has already reached the 35,000 point level and has also broken through 36,000, reaching a high of 38,000. The current pullback after the breakthrough requires adjustments and repairs to the indicators on the daily chart. It is believed that the adjustment in the bullish trend is for a better upward move.
[Trend Analysis: BTC Breakthrough After 4 Years]
On the monthly chart, BTC's performance has been outstanding, with a 28% increase in the past week, which is a good performance over the past decade. Looking ahead to the price outlook for November, the question is whether it will continue to rise or experience a pullback.
BTC's monthly chart shows a positive trend, with the 10-month and 30-month moving averages forming a golden cross above the 30-month line, indicating a bullish trend. Additionally, the MACD golden cross below the zero axis also indicates the start of a bullish trend, and the KDJ has turned upwards again.
After 4 years, BTC has once again shown a monthly chart with a positive trend, indicating that it is in the early stage of a bull market, and a genuine one at that.
Although history does not repeat itself, it does rhyme, albeit with different characters and stories.
[ETH Market Analysis]
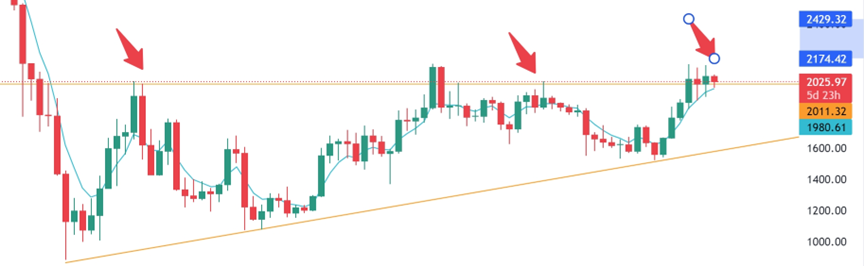
On the daily chart, ETH made a second attempt to break through the previous high of $2136 but was quickly suppressed. The MACD indicates that the adjustment may not be over yet, and there may be a risk of further decline. If it falls below 2040, the lowest support is around 1980U, where it may rebound after touching the 120-period moving average on the 4-hour chart. If it can stabilize at this level, it may retest the resistance levels at 2040 and 2136U, with support at 1930U below.
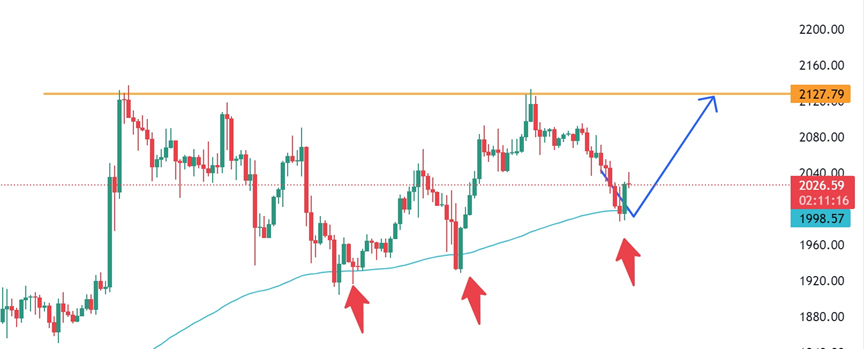
On the weekly chart, ETH has confirmed the formation of a bullish pennant, which is a positive signal. The price of ETH is still supported by the 5-week moving average at 1980U, and it recently rebounded from this level. Further observation is needed to see if there is an opportunity for another upward move to 2040-2136, depending on Bitcoin's performance for position adjustments.
[LINK Trading Review and Analysis]
Spot Layout: After breaking through the 500-day range, LINK experienced a brief correction before continuing its upward trend. Since October 20, LINK has been supported by the lifeline and has started a new uptrend.
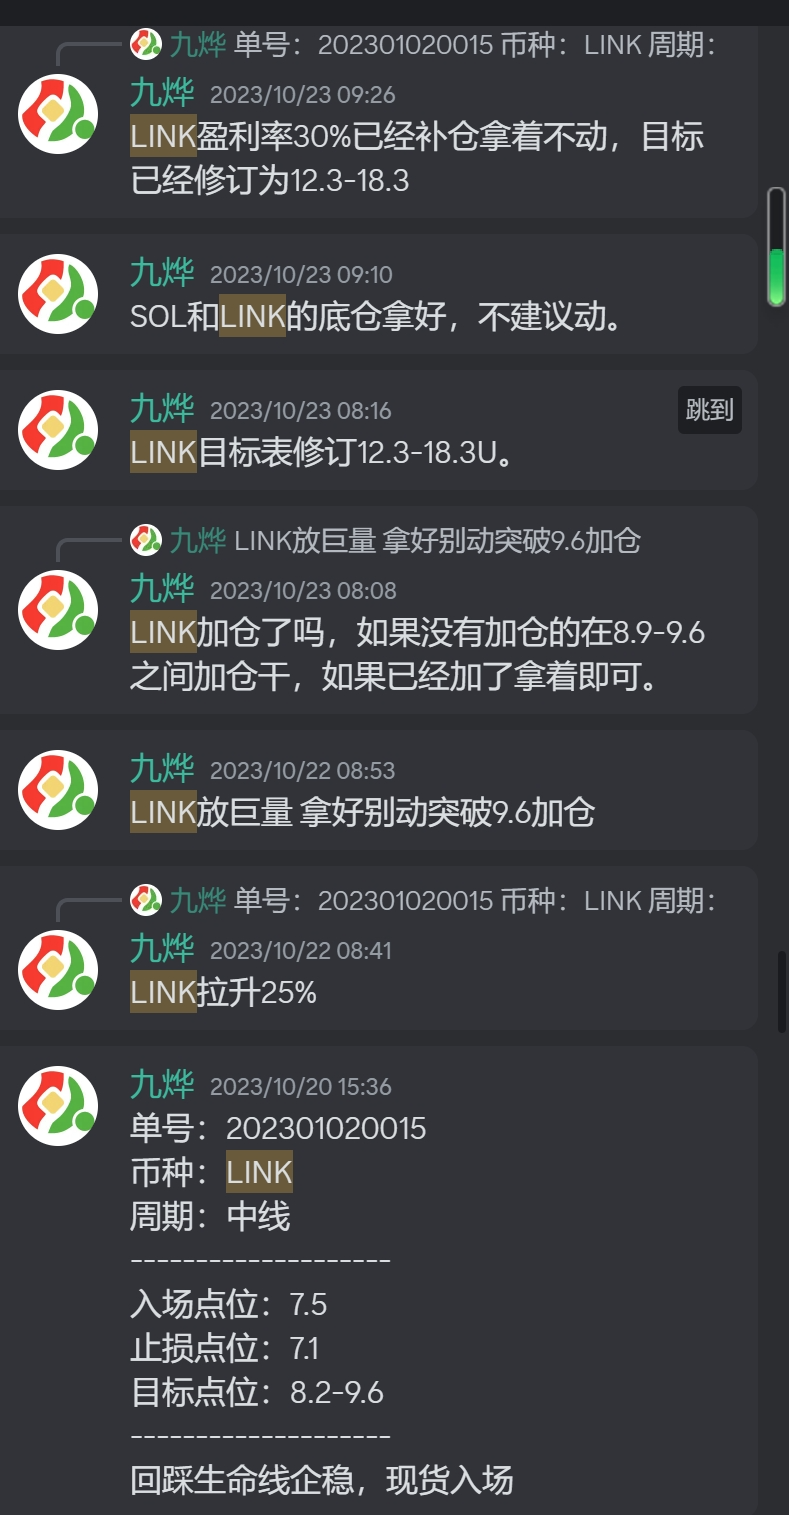
At the same time, according to the LINK trend adjustment, we have adjusted our trading plan, entering at 7.6U and adding positions and adjusting target levels after reaching the first and second targets, and the current return on investment is close to 100%. The breakthrough is a matter of time, the question is whether you can hold on, you can take out the principal and leave the profits for the crazy period of the bull market.
Attached image: LINK trading plan tracking path.
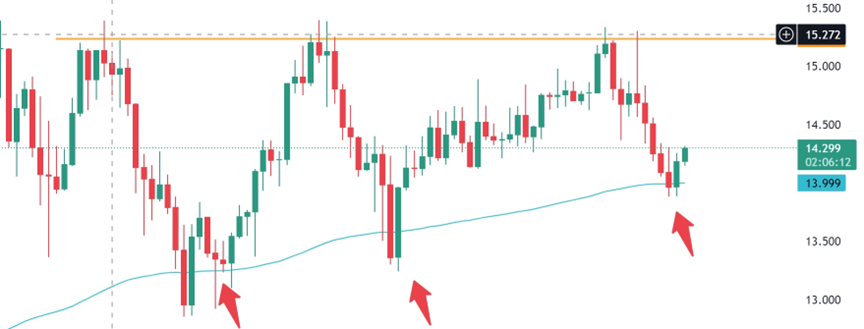
Today's Analysis: On the 4-hour chart, LINK has been supported by the 120-period moving average in the previous two instances, and yesterday's retracement formed a bullish engulfing pattern. The only downside is the lack of volume, but yesterday's candlestick pattern is good, with no significant changes, and the target remains at 15.3U.
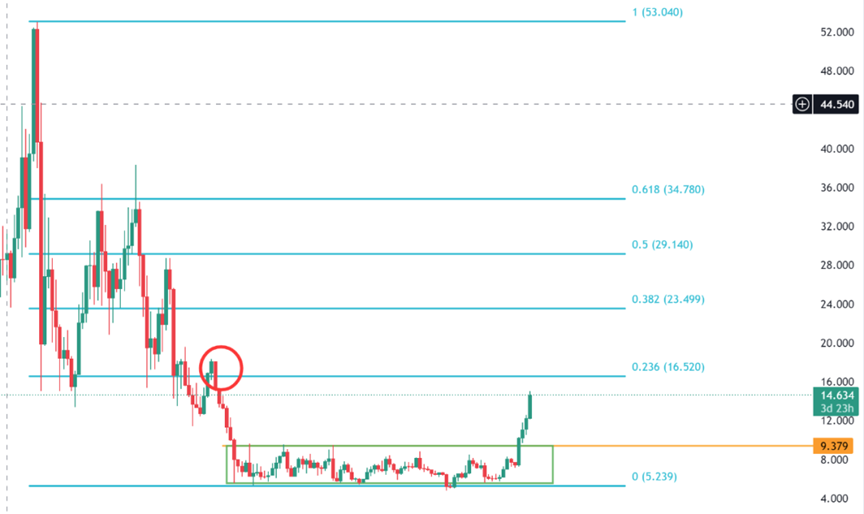
Trend Review: From the recent low point and the Fibonacci retracement level from the start of the previous bull market, the highest rebound encountered resistance at 23.6% and retraced, which is a normal technical retracement.
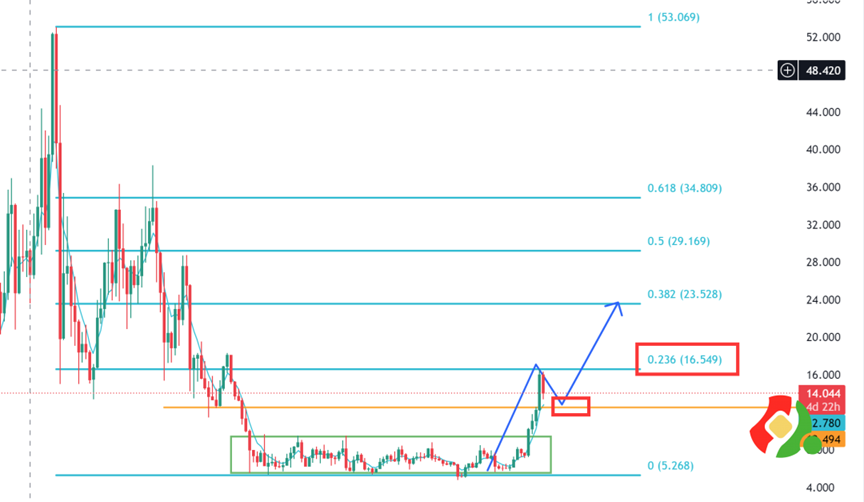
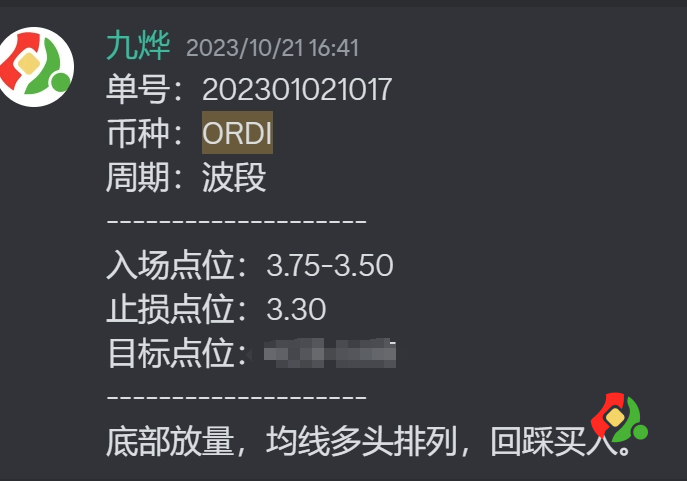
[ORDI Trading Review and Analysis]
Spot Layout: Starting from October 21, when ORDI broke through the lifeline, the entry area of 3.75-3.50 was clearly indicated.
In the following period, ORDI surged violently, broke through the neckline at 4.25U, and adjusted the target to $8.07, which is a chip-dense area. At this point, the profit has exceeded 100%, and it is suggested to exit with the principal and let the remaining profits fly.
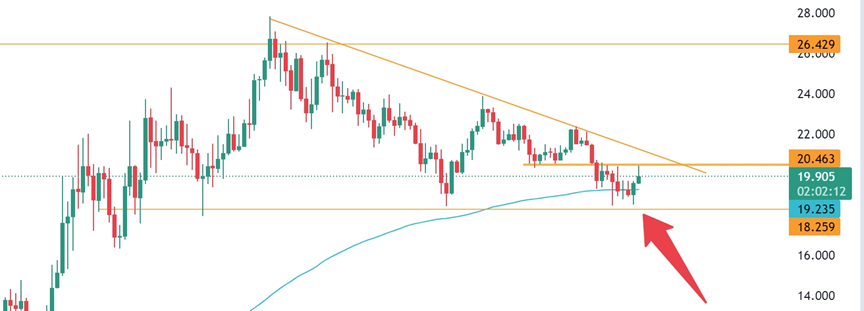
Today's Analysis: On the 4-hour chart, ORDI's price has once again fallen near the 120-period moving average. This time, it has fallen below a different level than before. The resistance level is still at 20.5U, which is also the suppression level of the downtrend line, with support at 18.5U.
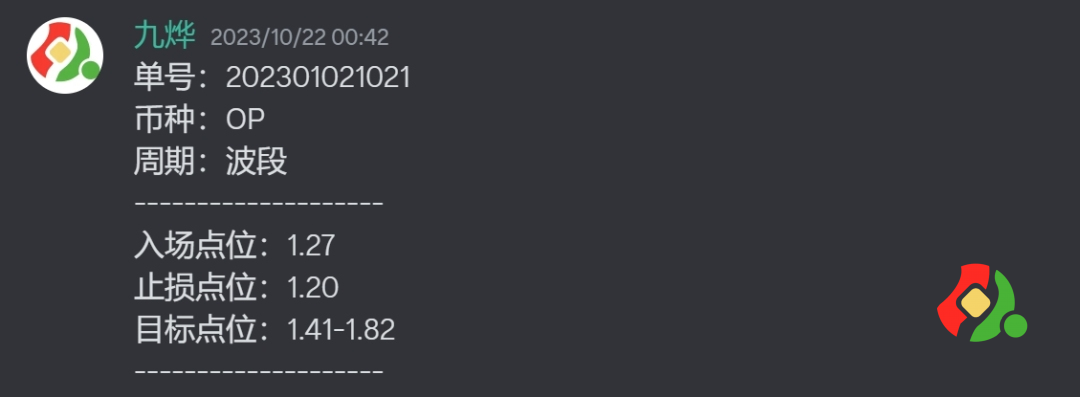
[OP Trading Review and Analysis]
Spot Layout: As the leading coin in L2, apart from ARB, we must pay close attention to OP. In the single number 202301021021, it was clearly mentioned to enter the position for OP, which is the bottom position. Add positions if it breaks through 1.42U, and it can still be added if it breaks through 1.83.
However, the price has been oscillating around 1.80, repeatedly shaking near the weekly chart neckline, which is likely to be a washout behavior. Pay attention to the breakout situation of OP after the stability of the overall market.
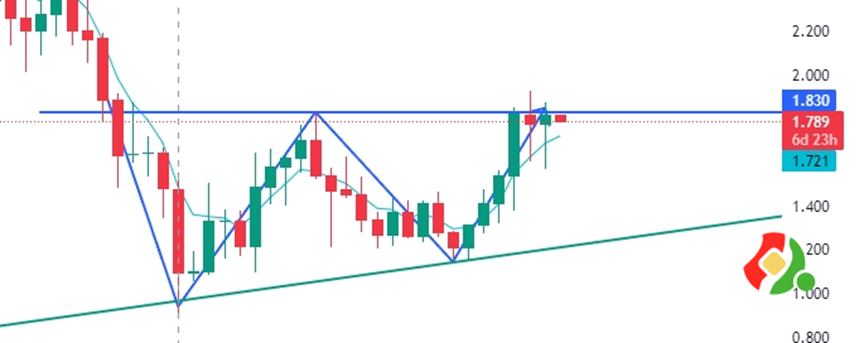
On the weekly chart, the past two weeks have shown long lower shadows but have not held above 1.83U, which is more evident on the daily chart. The consolidation around 1.83 has been lengthy. This level also signifies the importance of the weekly chart neckline. A breakout will lead to a larger upside potential, with support at 1.73U below.
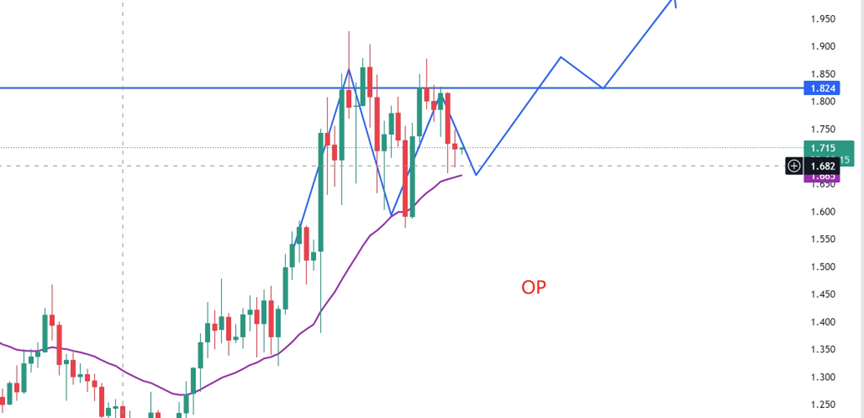
On the daily chart, the price has been rising along the lifeline, and the last time it touched near the 1.60U lifeline, it started to surge. This time, it may stabilize near the lifeline. Pay close attention to the performance of the MACD below. If a golden cross or a volume surge with a long bullish candle appears, it can be re-entered and added to the position.
[Position Adding Techniques] Why choose to gradually add positions after a breakthrough?
Because we only do the right things.
Instead of adding positions on every retracement to obtain lower price chips?
If the price of a coin does not move in the expected direction after we buy it, but instead moves in the opposite direction, it means we are wrong. At this point, triggering a stop loss and exiting is the right move, not adding positions to increase the risk.
Only when the price trend moves in the expected direction, indicating that we are right, can we consider re-entering after each breakthrough, until the trend deteriorates and we exit completely.
Let the profits fly for a while, don't be in a hurry to take profits and exit. If the trend emerges, persistence and holding are the best strategies, not being anxious every day, fearing that the profits will slip away!
[Quotes from Jiu Ge]
1. Candlestick language is a result, everything we know or don't know, everything happening or about to happen, will be reflected in the candlestick language.
2. The rise is the best reason for the rise, and the fall is the best reason for the fall.
The trend has arrived, don't think about a sharp decline or the reasons behind it. The candlestick tells us everything. With time verification and continuous price increase, the answer will be revealed.
3. Once the trend is formed, it will not change easily. You just need to follow the trend, ignore all external news, focus on the candlestick language, focus on the trading system, and ignore everything else as it is a distraction.
免责声明:本文章仅代表作者个人观点,不代表本平台的立场和观点。本文章仅供信息分享,不构成对任何人的任何投资建议。用户与作者之间的任何争议,与本平台无关。如网页中刊载的文章或图片涉及侵权,请提供相关的权利证明和身份证明发送邮件到support@aicoin.com,本平台相关工作人员将会进行核查。


