Click to watch the video: Master Chen 11.20 Video: Has the market reached the top? Analysis of bottom and top indicators
In today's video, I will share with you another indicator on how to buy the bottom and avoid the top. I've noticed that many friends missed the bottom of Bitcoin at 15,000 or 25,000, and many fans are feeling a bit panicked about the recent market fluctuations. So today, let's talk about how to overcome this mindset and share some knowledge about Bitcoin's current situation, which is not the top, and some chart analysis.
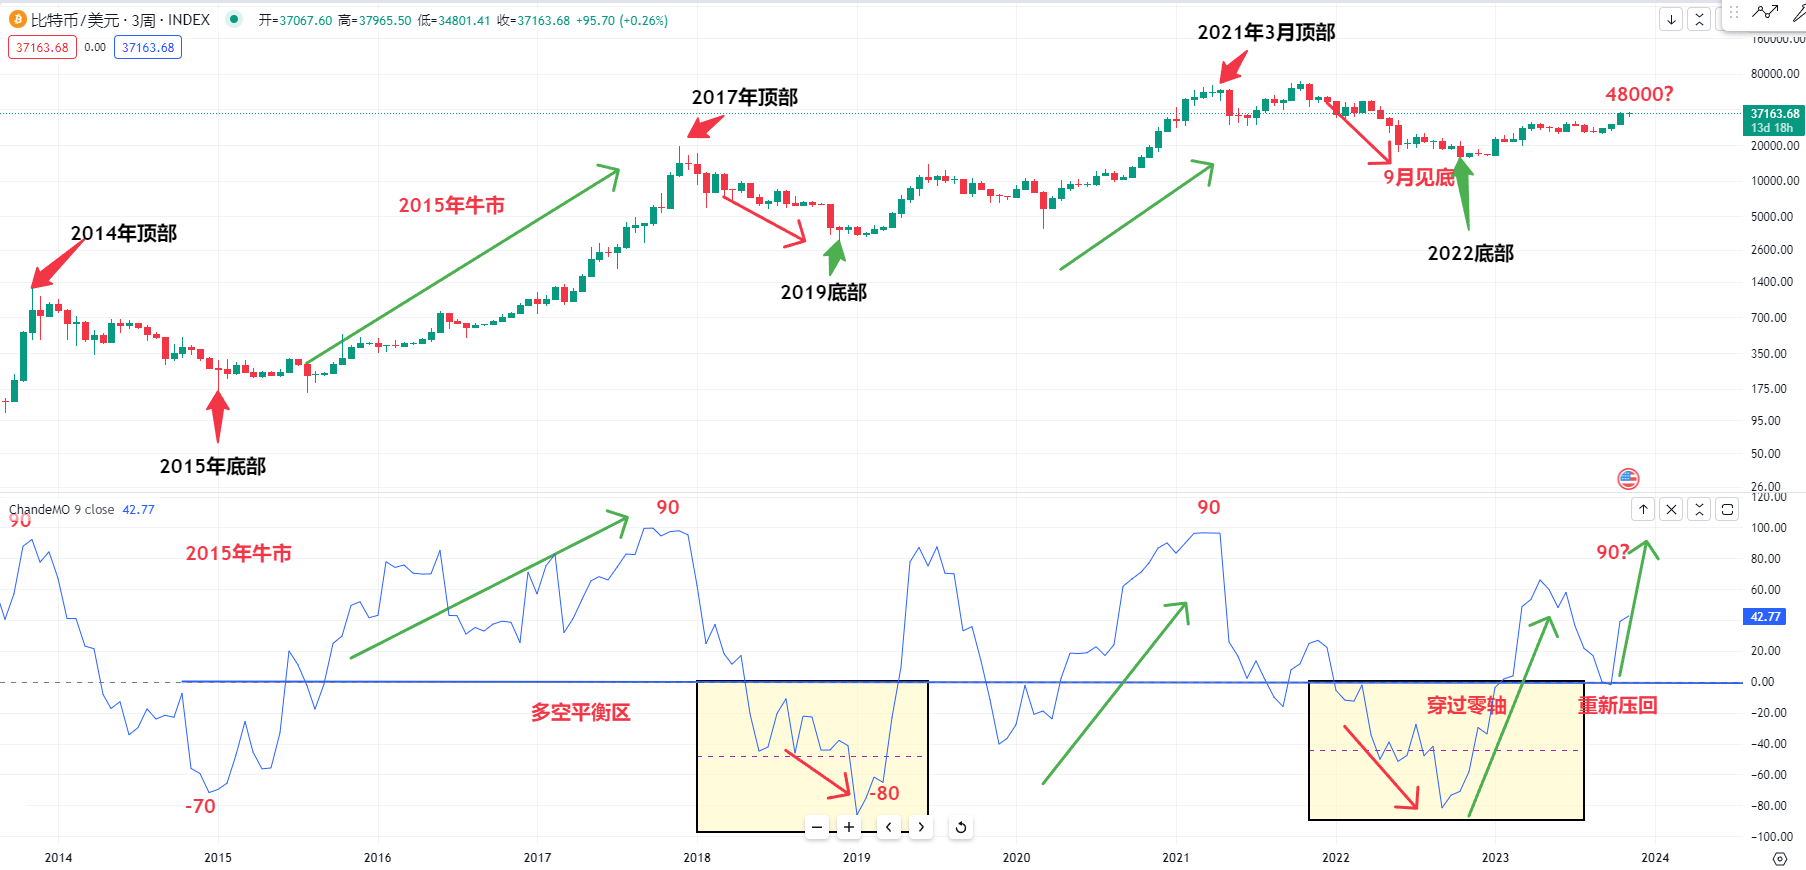
First, let's take a look at the three-week chart of Bitcoin and the CMO indicator. I've discussed many indicators or methods to determine the bottom of Bitcoin in 2022. Many people are doubting whether Bitcoin will fall back to 32,000 or even return to 20,000 or 10,000.
We can see from the CMO indicator in the three-week period that a very obvious mid-axis position is a very important area of balance between long and short. We can see that during the bear market of Bitcoin from 2018 to 2019, if it had been consistently above this zero axis, it would have been a very big bull market.
If the CMO indicator falls below 0 within the three weeks, then we can see that Bitcoin at that time was in a very big bear market. At the bottom position, we can also see the value of the CMO indicator, which dropped to around 80, which is a very important bottom for Bitcoin in 2019.
So, looking at the CMO indicator for Bitcoin in 2022, when it comes below 0, it is a very important bear market. Now, it has already broken free and surpassed this zero axis. I have been telling everyone that it is currently a very important bull market. It has come back to test this zero axis and is now back above the zero axis.
There are still people doubting Bitcoin's bull market. If we look at the historical structure of Bitcoin's bull market, it has always been above this zero axis, including the big bull market of Bitcoin in 2015. It has been consistently maintained above this zero axis while this indicator was rising.
So, there is no need to doubt Bitcoin's bull market now. It may rise to a high position in the future. Next, I will talk to everyone about how to judge the top. So, we can use Bitcoin's chart to observe several important bottoms in Bitcoin's history. In 2015, the bottom of the CMO indicator came directly to around -70, which is a very important bottom corresponding to this low point.
Or in 2019, at the bottom, the CMO indicator also came to around -80, which is a very important bottom. After that, Bitcoin started to rise. So, we can see that in 2022, Bitcoin's market is the same. When it crosses below the zero axis, it may start to slowly find the bottom.
So, you must use each major drop or collapse to buy in these ranges. There are also some references for the high positions at the top. We can see that in March 2021, when Bitcoin was at a high of 65,000, the CMO indicator also came to this range, around positive 90, which may also represent a risk for Bitcoin.
Or we can observe that it later collapsed. We can also see that at the top of Bitcoin in 2017, the CMO indicator was also around 90, indicating a very high risk. After that, Bitcoin went through a very long bear market. Or we can see that at the top of Bitcoin in 2014, it was also at this high position, and the CMO indicator came above 90.
We can pay attention to this position, which is a very important high point at the top. After nearly 13 months of decline, Bitcoin may have bottomed out. So, in the current market, we can observe that after Bitcoin bottomed out in this area in September 2022, the current three-week chart of Bitcoin is very clear. We can clearly observe that the CMO indicator below has crossed the zero axis, then repressed back to the zero axis, and is now continuing to rise.
So, in the current space, I feel that this CMO 90 is still very far away. It is not ruled out that after this position shakes out, it may continue to break through. Because my view is still the same, it is believed that it will break through the high point of 48,000 before the halving of production.

Next, let's take a look at the daily chart of Bitcoin. Last time, I also mentioned to everyone that there is a very strong upward consolidation structure here. Now, in these few days, it continues to tilt upwards.

In my personal opinion, the current form is very similar to the position in 2020. We can see that at that time, there was a slanted upward consolidation structure before this candlestick, or at this position, there was also a slanted upward consolidation structure. This range can be considered a consolidation.
So, from the previous consolidation structure, starting from the low point of this candlestick, to when Bitcoin rose to nearly 20,000, we can see that the space here increased by nearly 40%. In my personal opinion, Bitcoin may not exclude starting from the first upward consolidation, and if it rises another 35% from the low point of this range, around 35,000, it can easily challenge the high point of 48,000.
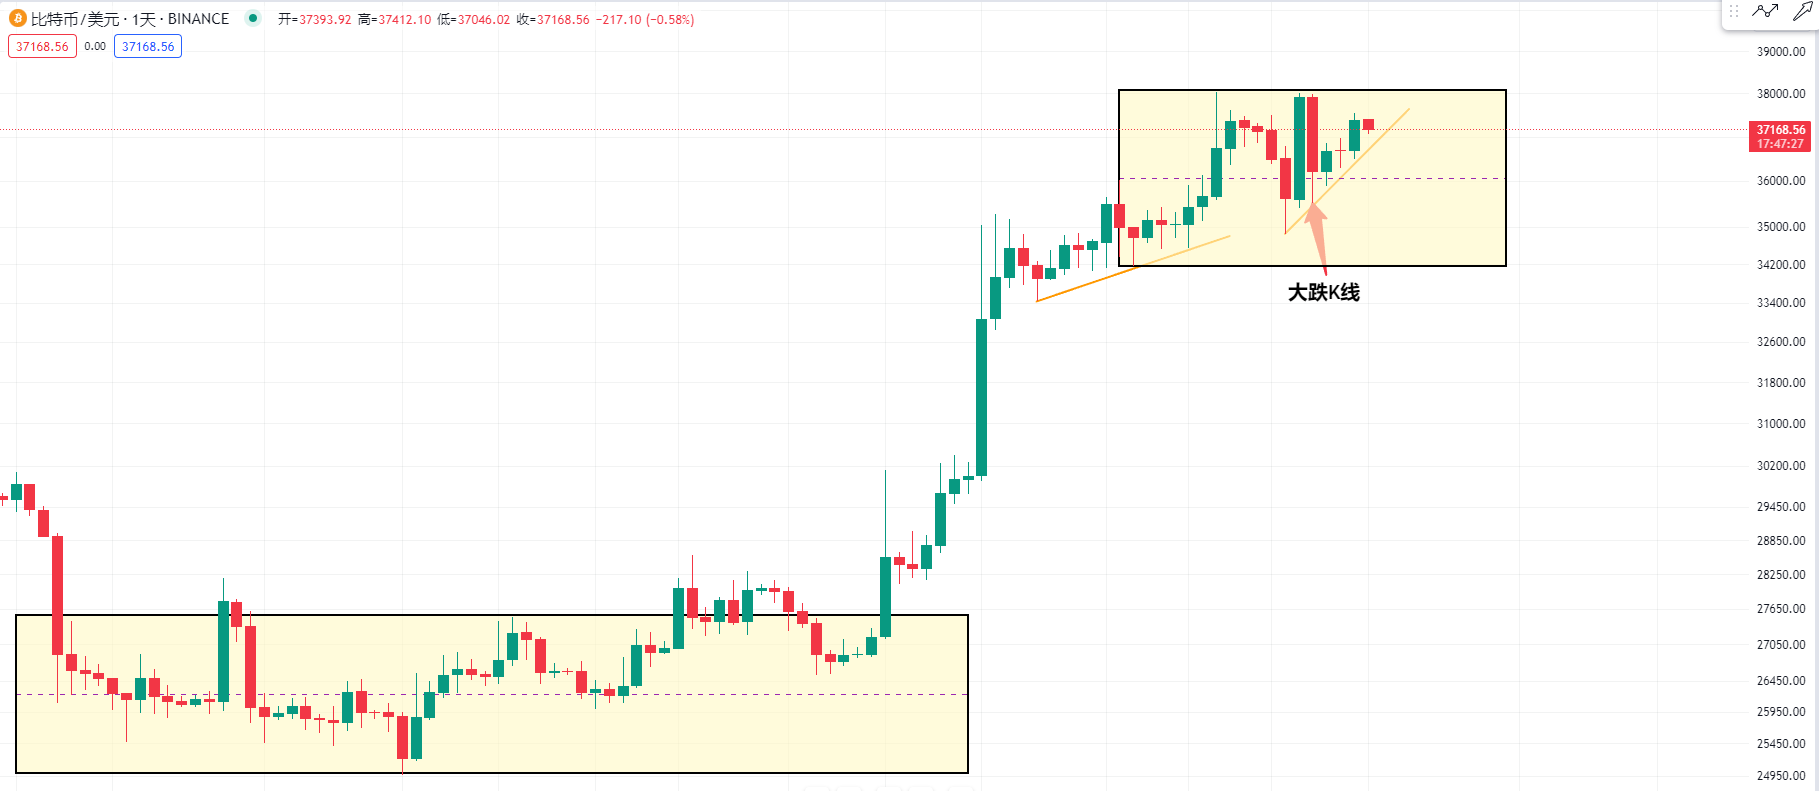
Then let's observe whether this is a diamond pattern. In my personal opinion, I disagree. I have previously told everyone that in the consolidation structure, it is weak if it is strong in the middle, especially if this candlestick has a big drop, and then there is a bullish resistance candlestick. So, in this form, in my personal opinion, it is not a diamond. In the weakest case, if it really breaks this trend line, it may still be consolidating in this range for about 34 days. Is it possible to continue to break through at the end of November? However, I personally lean towards the fact that this position is currently very strong and may continue to attack. Will it directly challenge 48,000?
For more strategies, you can join the live trading.
Candlesticks are king, trends are emperor. I am Master Chen, focusing on BTC, ETH spot contracts for many years. There is no 100% method, only 100% trend following. Daily macro analysis articles are updated on the entire network, and technical analysis review videos.  Friendly reminder: Only the public account of the column (shown in the picture above) is written by Master Chen. The advertisements at the end of the article and in the comments section are not related to the author. Please be cautious in distinguishing between true and false. Thank you for reading.
免责声明:本文章仅代表作者个人观点,不代表本平台的立场和观点。本文章仅供信息分享,不构成对任何人的任何投资建议。用户与作者之间的任何争议,与本平台无关。如网页中刊载的文章或图片涉及侵权,请提供相关的权利证明和身份证明发送邮件到support@aicoin.com,本平台相关工作人员将会进行核查。


