11/15/Community: The oscillating market in the bull phase officially begins…
Course Content: Three consecutive wins on the right side strategy with a 400% return
Live room shares various mainstream technical indicator application methods, as well as the analysis of the technical form on the day;


[ETH/Daily Chart]

ETH/Daily Chart: Yesterday's market unfolded a fierce oscillating market with long and short positions after the release of the US CPI data; finally
The daily K-line showed a more obvious neutral line form; in terms of indicators, the price hit a certain support at 10ema-15ema, performing at a price of 1920; the closing price fell to 1980, presenting a long lower shadow line form; yesterday's market indicated a temporary pause in the unilateral bull market; the later market will enter a period of range oscillation around 2140-1920; if 1920 is breached, there may be a deeper retracement space; short-term operations can try to maintain a high sell and low buy strategy;
[ETH/4-hour Chart]
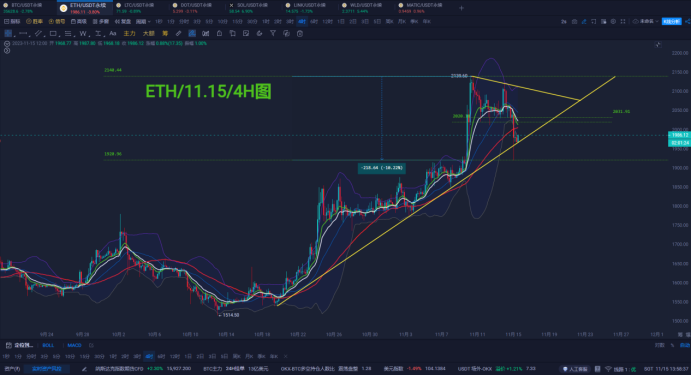
ETH/4-hour: In terms of the 4-hour technical trend, there are two possible future trends as shown in the figure:
First possibility: The oscillating range is between 2140-1920, with 2020 in the middle as a short-term long and short watershed. Breaking through 2020 will test the upside at 2120-2140; failure to break the previous high will maintain oscillation and fall back.
Second possibility: A continuation pattern of a triangle shape within the box, entering a narrow consolidation and choosing direction again; short-term high sell and low buy; the bearish approach first focuses on the performance below 2020, with resistance signals appearing at the hourly level, and can try to enter a short position; the target is around 1920; wait for the appearance of the third high point above 2020 before considering entry; the bullish approach can focus on whether there is a clear bottom structure in the 1920-1950 range, and then consider the low long opportunity above 1920; for more details, welcome to join the live room for discussion and exchange!

Recommended approach [Daily chart bullish, 4-hour oscillating]
Support 1950-1920/Resistance 2020-2030
Tencent Meeting ID: 565-877-8060
Seven live broadcasts daily from 14:00 to 21:30

[Liejinshe] What can you get from the elite class?
1. Get midday videos at the first time//2. Get market intraday views at the first time
3. Get short, medium, and long-term strategies at the first time//4. Track and guide strategies throughout
5. Have the opportunity to participate in exclusive midnight battles//6. Have the opportunity to participate in million-level courses
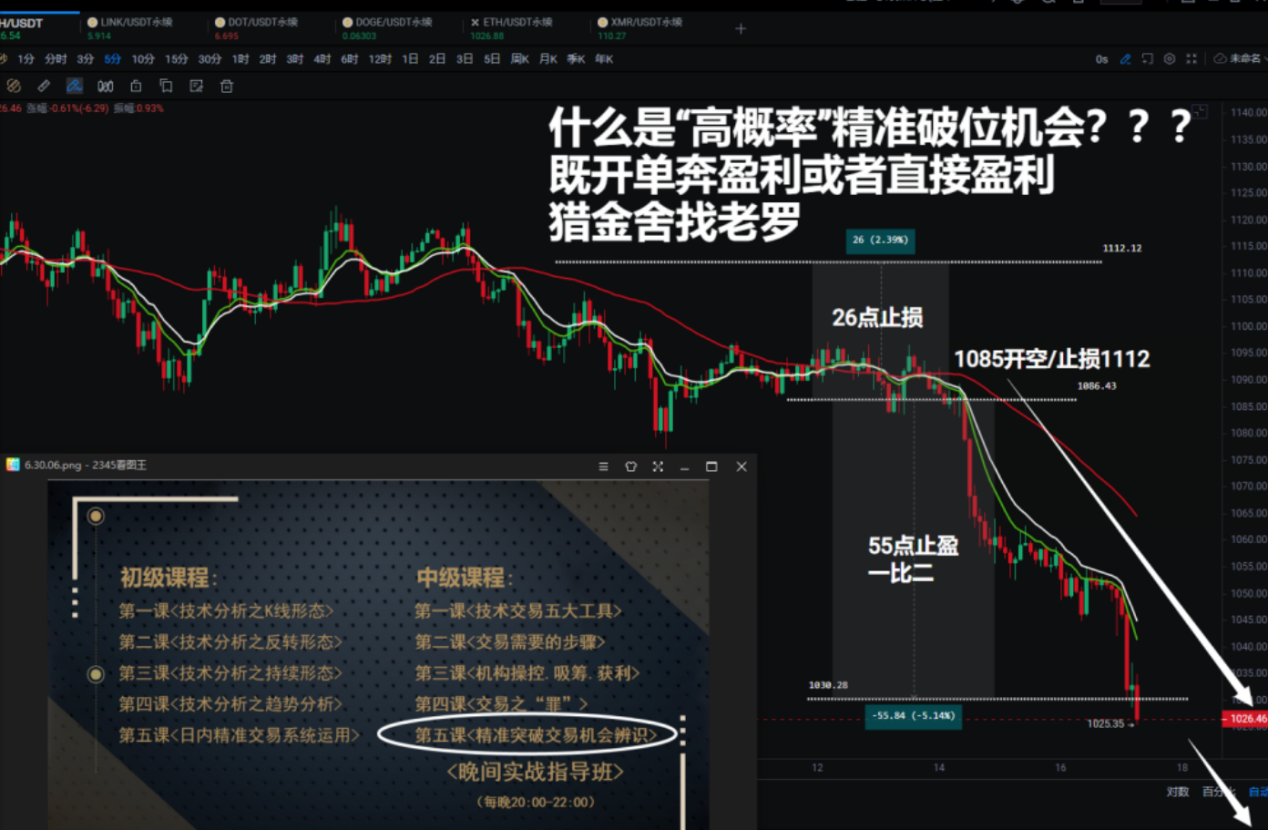
[Efficient. Accurate. Breakthrough trading opportunities capture]

February 2022-December///10 wins 1 loss
February complete/Return rate 2500%///March complete/Return rate 2500%
April complete/Return rate 2626%///May complete/Return rate 3698%
June complete/Return rate 3081%///July complete/Return rate 7033%
August complete/Return rate 4694%///September complete/Return rate 5046%
October complete/Return rate 1438%///November complete/Return rate 2362%
December complete/Return rate -474%///
February-December 2022 complete total return rate 34504%
Single margin of 100U*34504%=34504U
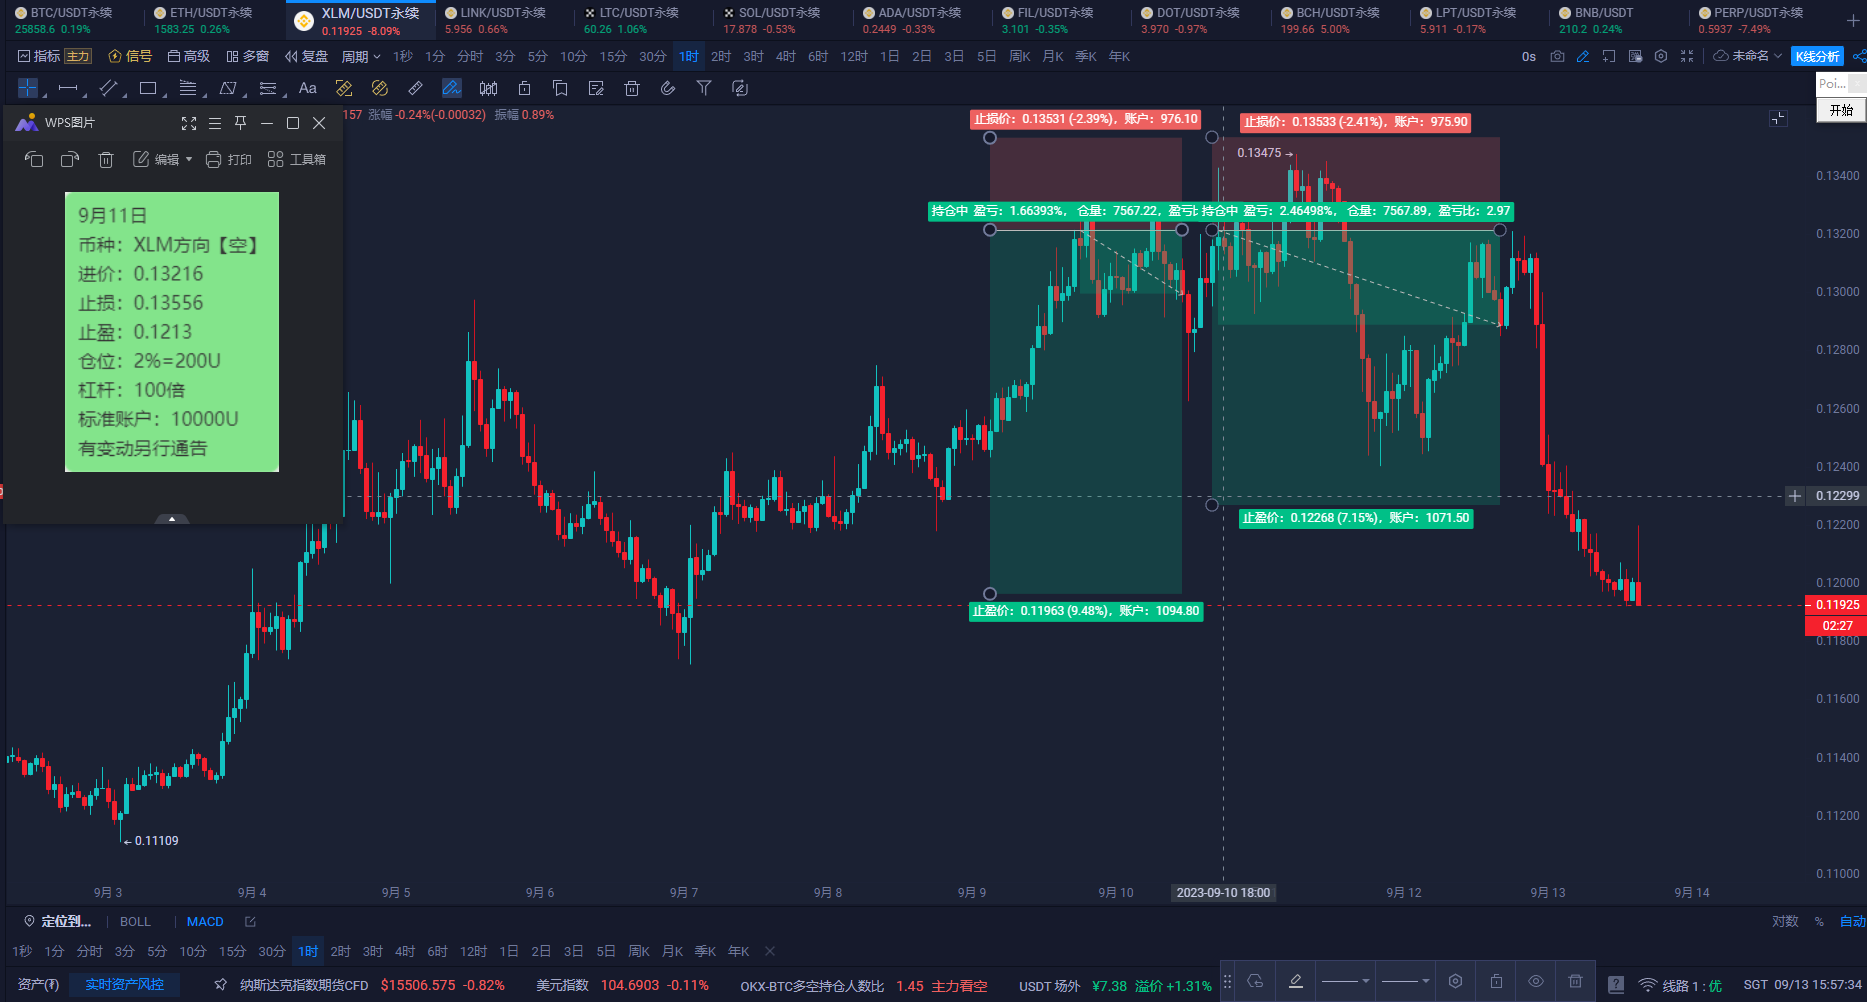
Each strategy//has evidence and traces. Can be traced back to the start time to the year, month, day/hour, minute, second, and retained in text and images//Interested parties can scan the code to join the group for certification!!


(Scan the code to follow the official account and experience more services)
免责声明:本文章仅代表作者个人观点,不代表本平台的立场和观点。本文章仅供信息分享,不构成对任何人的任何投资建议。用户与作者之间的任何争议,与本平台无关。如网页中刊载的文章或图片涉及侵权,请提供相关的权利证明和身份证明发送邮件到support@aicoin.com,本平台相关工作人员将会进行核查。


