
The yields of the 10-year, 20-year, and 30-year U.S. Treasury bonds have continued to reach new highs, with rates at 4.9%, 5.3%, and 5.1% respectively, showing no obvious signs of decline. The S&P 500 and Nasdaq indices have been in a downtrend, and previous articles have warned about shorting the U.S. stock market, which has since dropped by 5-8 points. The U.S. dollar index has fallen to retest the support of the daily triangle and is poised to challenge the high of 107.3469. If it breaks through again, there is a chance it could reach around 109.
Bitcoin
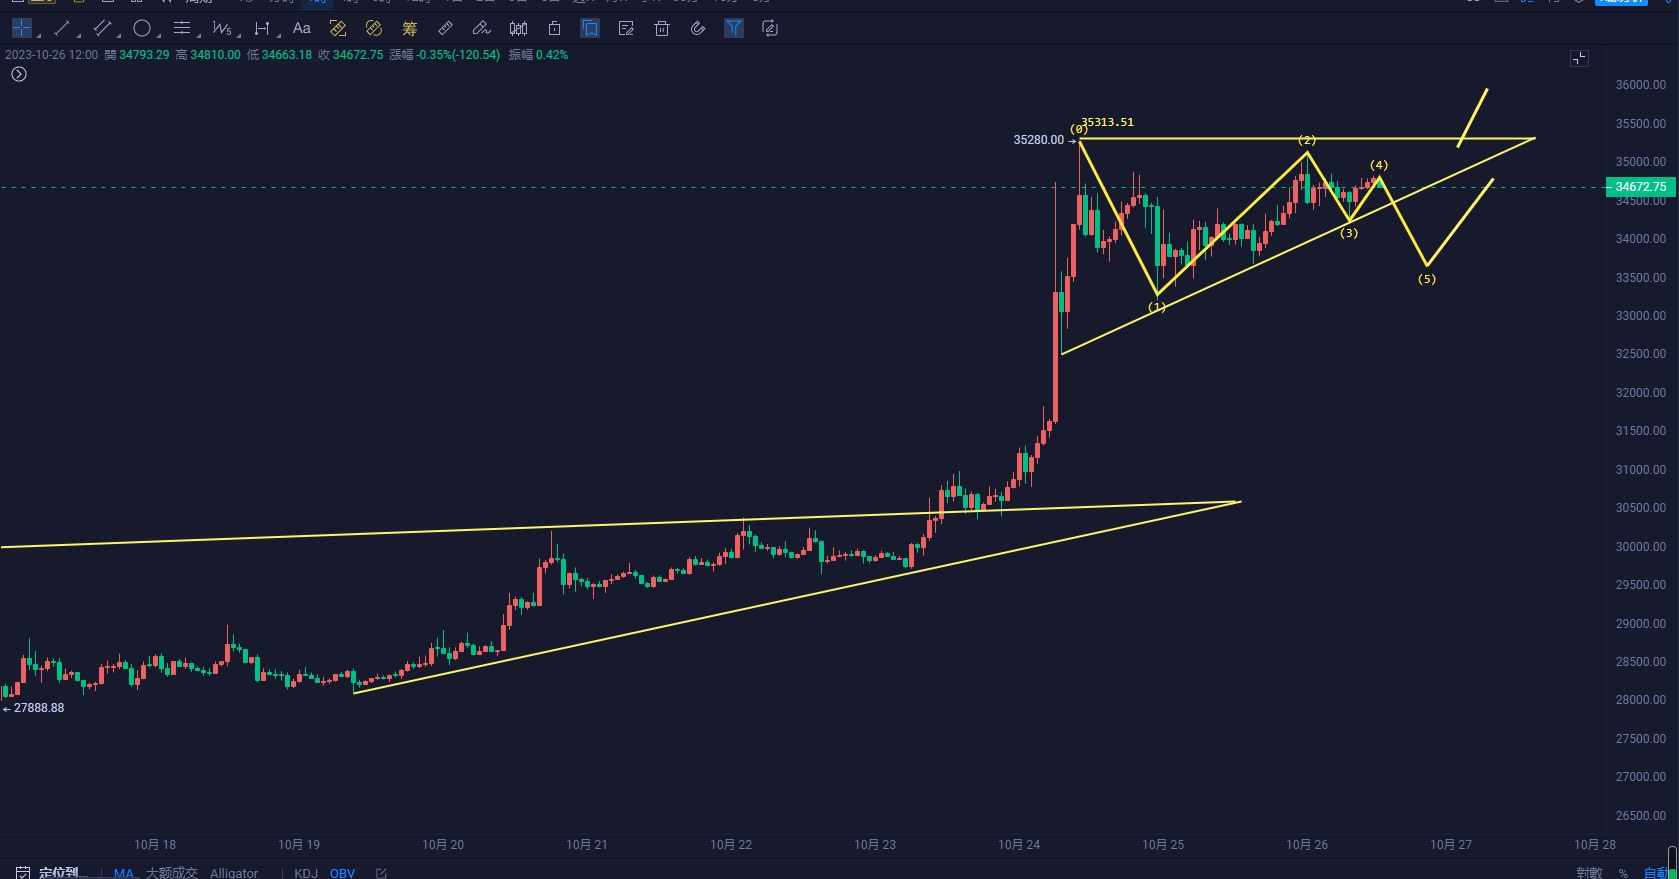
On the hourly chart, it has formed a triangle pattern, with the low point rising and the high point being suppressed around 35000. Pay close attention to the direction of the triangle. If it breaks through, there is a chance it could rise to around 38500. If it falls to around 33000, consider the opportunity to buy in again.
Daily Chart
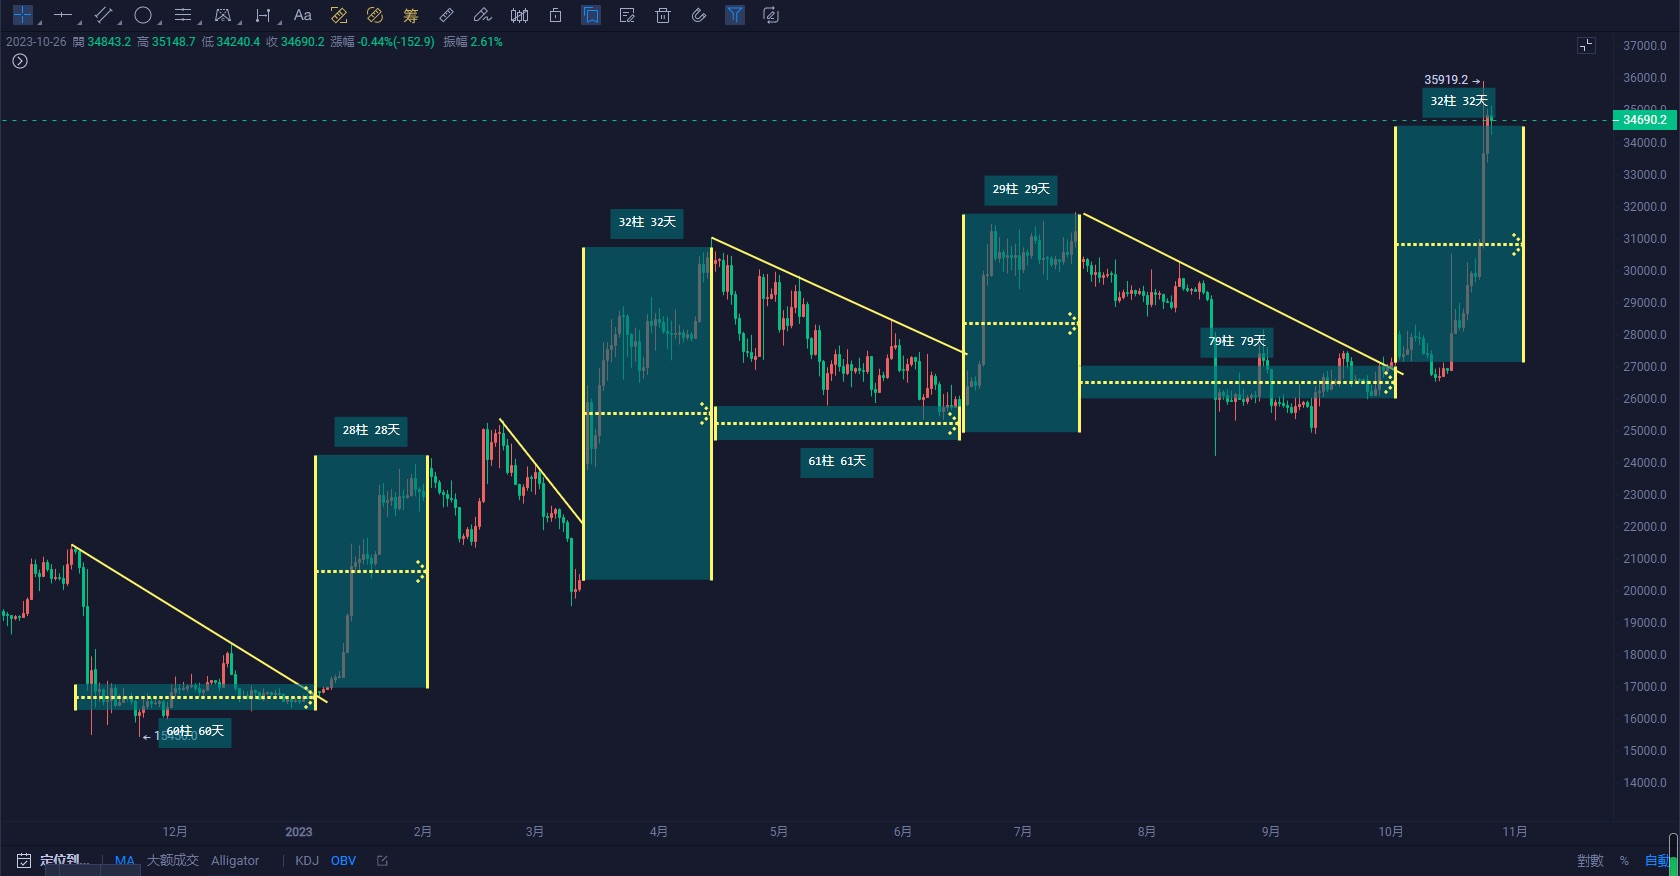
The OBV indicator has broken through the bull-bear dividing line of 32000, which has lasted for more than 530 days. In the bull market of 20-21, the M-shaped pattern broke through after more than 490 days, so as long as it can stay above 32000, it should not be overly bearish. The RSI has entered the oversold area, and the rapid rise in the market should not be chased. If you do chase, it should only be for short-term opportunities. Refuse to FOMO and operate randomly, as it is more likely to lead to losses.
There is also a relatively regular timeline that can be referred to, as shown in the image below.
Ethereum
Ethereum broke through the short-term resistance at 1740 and it is difficult to break through 1854 in the short term. A pullback to 1730-1740 without breaking is still an entry opportunity.
Daily Chart
It has returned to the triangle range between the downtrend line of 2141 on the daily chart and 1740, and the probability of choosing a direction is relatively high.

In the face of absolute funds, short-term technical indicators are ineffective, but can naked K-line still show strength or weakness?
If you like my views, please like, comment, and share. Let's navigate the bull and bear markets together!!!
The article is time-sensitive and is for reference only, with real-time updates.
Focus on K-line technical research, win-win global investment opportunities. WeChat public account: 交易公子扶苏

免责声明:本文章仅代表作者个人观点,不代表本平台的立场和观点。本文章仅供信息分享,不构成对任何人的任何投资建议。用户与作者之间的任何争议,与本平台无关。如网页中刊载的文章或图片涉及侵权,请提供相关的权利证明和身份证明发送邮件到support@aicoin.com,本平台相关工作人员将会进行核查。


