前天晚上和昨天早上本号均在文章和社区里多次清晰的提示大饼抄底买入为主,BTC昨天一波拉涨最高反弹到了26567,对于短线交易者来说1000多点利润到手,跟上节奏的小伙伴都吃上肉了。
从大饼结构上看当下仅是反弹了4小时一笔,力度尚可本轮反弹大概率没有走完,中长线最少等待日线级别走出向上一笔再看,日线一笔则最少要走5天以上。中间出现的小级别波动交易水平高的可以拿一部分仓位打短差,水平不好的就做个保本损先拿着,出现大级别卖点的时候本号也会在社区及时提醒。
回到今天文章主题ETH,ETH长时间走势大部分都是弱势跟随大饼。本轮从4月16日高点2141的回调已经持续震荡向下走了接近5个月时间,直到昨天再次创下回调低点1531,回调总幅度超过28%。联立起大饼即将要走日线级别向上一段预期来看,当下不宜继续过分看空ETH,相反应该找买点分批买入为主。
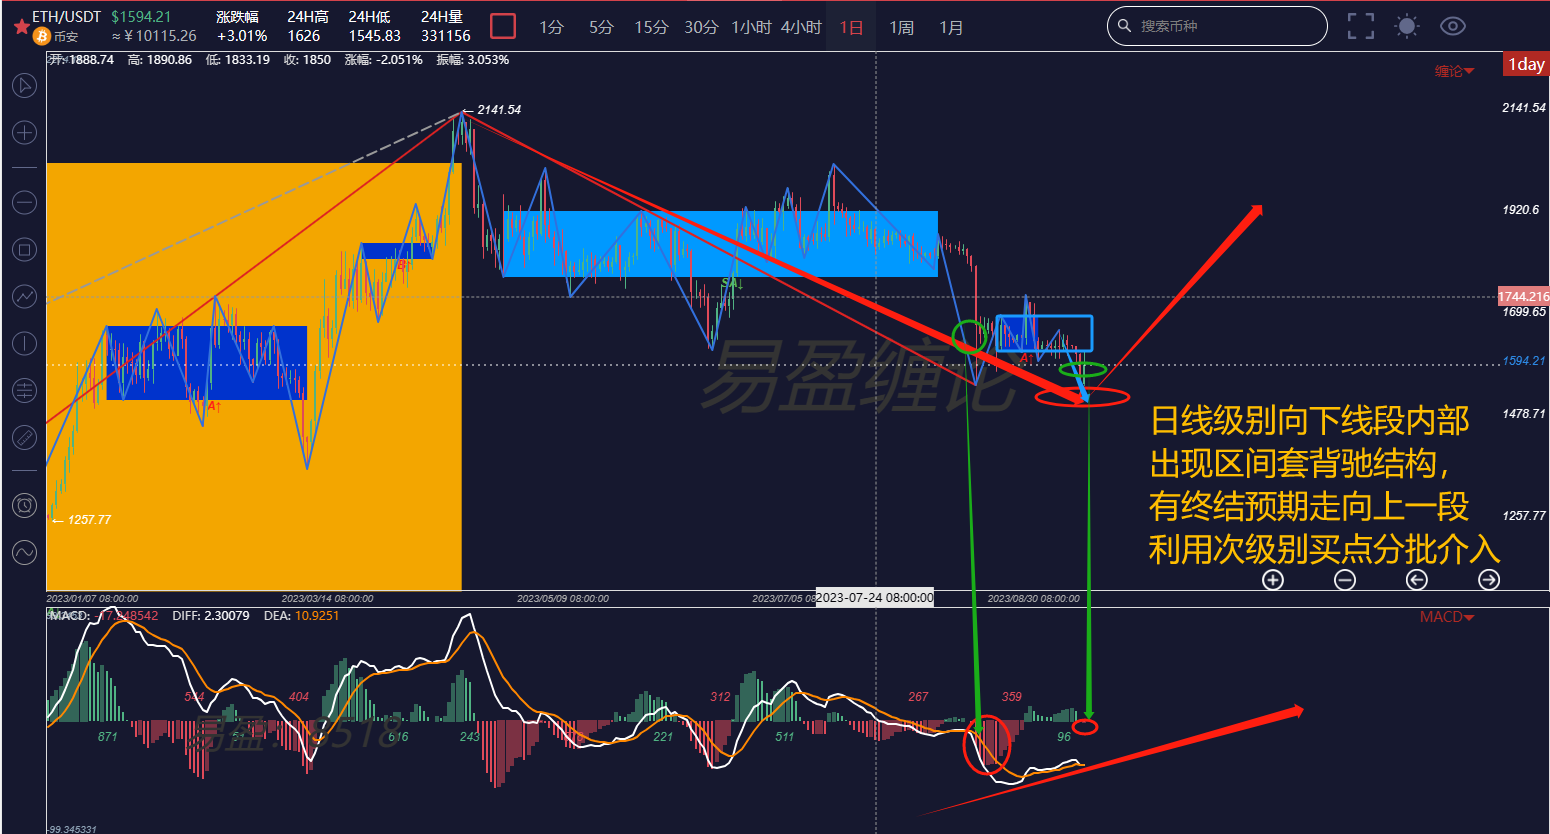
先看日线图,日线从2141高点向下的这一段一直向下延伸,直到昨天再次创下回调低点1531。从向下线段内部结构上看已经出现区间套背驰结构,是可以终结的。因此从大的方向看要以做多为主,利用次级别买点分批介入,预期日线向上一段。
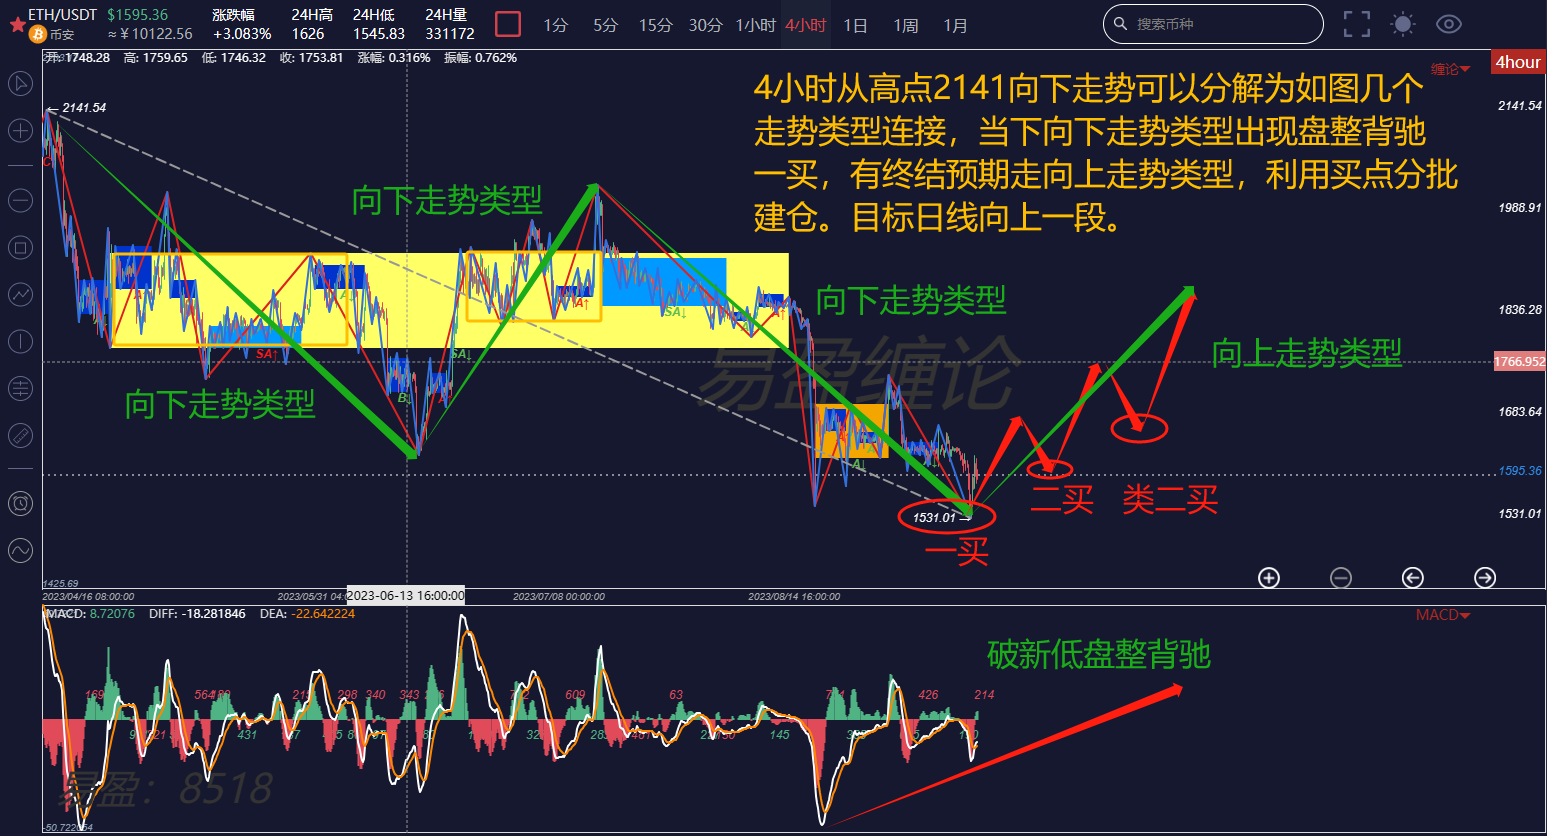
再看日线级别对应的次级别4小时图,日线向下一段内部的结构就非常清晰了。如图从2141高点向下可以分解为几个走势类型的连接,昨天创下1531低点后,出现4小时盘整背驰一买,向下走势类型结构饱满是随时可以终结的。因此当下的主要策略就是以回调买入做多为主,预期走如图中的4小时向上走势类型。
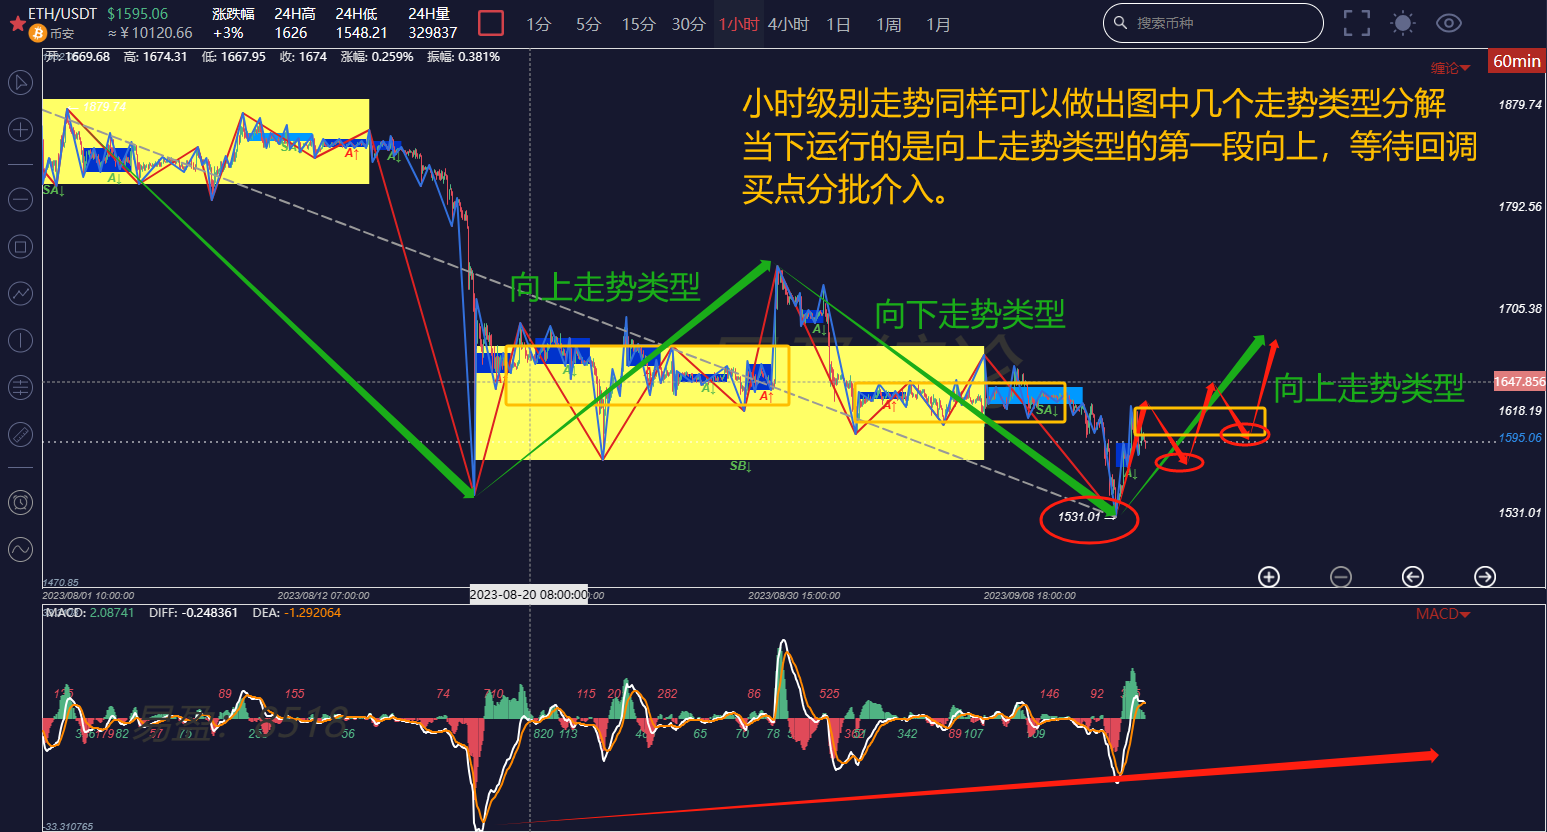
最后再看小时图,同样道理小时级别也可以做出同级别分解。缠论技术的自相似性和自同构性,使结构走势看起来都很像。从图中可以看出小时即将要走向上走势类型,因此中短线的操作方向依然是回调做多为主,出现买点分批介入。
缠论交易技术的最大特征就是一切以结构为主,抛弃一切主观臆测和幻想,根据所做的级别及结构,买点买卖点卖,仅此而已!
朋友们如果对缠论感兴趣,想免费获取缠论学习资料,收看公开直播,参加缠论线下训练营,学习缠论精进自己交易技术,构建自己交易体系达到稳定盈利目标,利用缠论技术及时逃顶和抄底。可以扫码关注以下公众号私聊获取和添加本号微信进群学习!

特别提示:文末本提示下方是插入广告非本号联系方式,请注意甄别!
免责声明:本文章仅代表作者个人观点,不代表本平台的立场和观点。本文章仅供信息分享,不构成对任何人的任何投资建议。用户与作者之间的任何争议,与本平台无关。如网页中刊载的文章或图片涉及侵权,请提供相关的权利证明和身份证明发送邮件到support@aicoin.com,本平台相关工作人员将会进行核查。


