Analysis of Monthly Trends
At the beginning of August, the market continued to be sluggish. To break the deadlock and seize the major market trends, we need to analyze the overall market trend from the monthly chart perspective.
From April to August, the market trend has been characterized by sustained consolidation and oscillation. This continuous consolidation has not expanded the market landscape but has instead led to a sense of disillusionment among retail investors. Some even consider giving up. If such thoughts arise, congratulations, this is exactly what the main players want to see. Only when retail investors lose confidence in the market or still hold a glimmer of hope, will the main players (CM) mercilessly continue to suppress the market. They will use tactics such as testing, shaking out weak positions, and even the ultimate shaking out to force the public traders to completely abandon the chips in their hands. Only then will CM truly intervene and drive the market. At present, CM has not yet participated. As retail investors, we need to pay attention to the trading volume and the movement between prices to consider how to position ourselves.
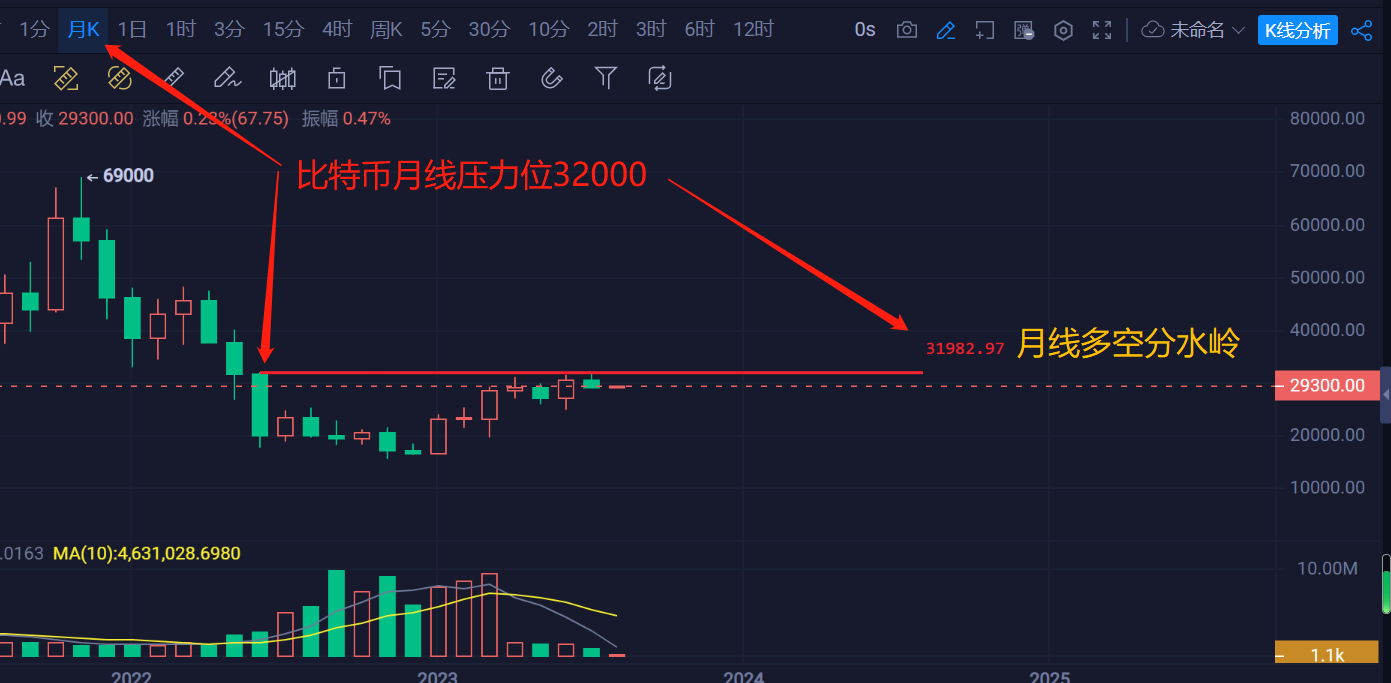
In the monthly chart analysis, the current pressure level for Bitcoin is around 32000. There is a chance for the monthly chart to challenge the 32000 level. If the market attempts to break through the 32000 level without success, a new round of bearish trend will be initiated. This will be the final showdown where CM will test the top pressure. If the expected outcome is achieved, the market will enter a bull market ahead of schedule. Otherwise, the market will fall again, with a depth of decline far beyond everyone's expectations, possibly even falling to the monthly low point.
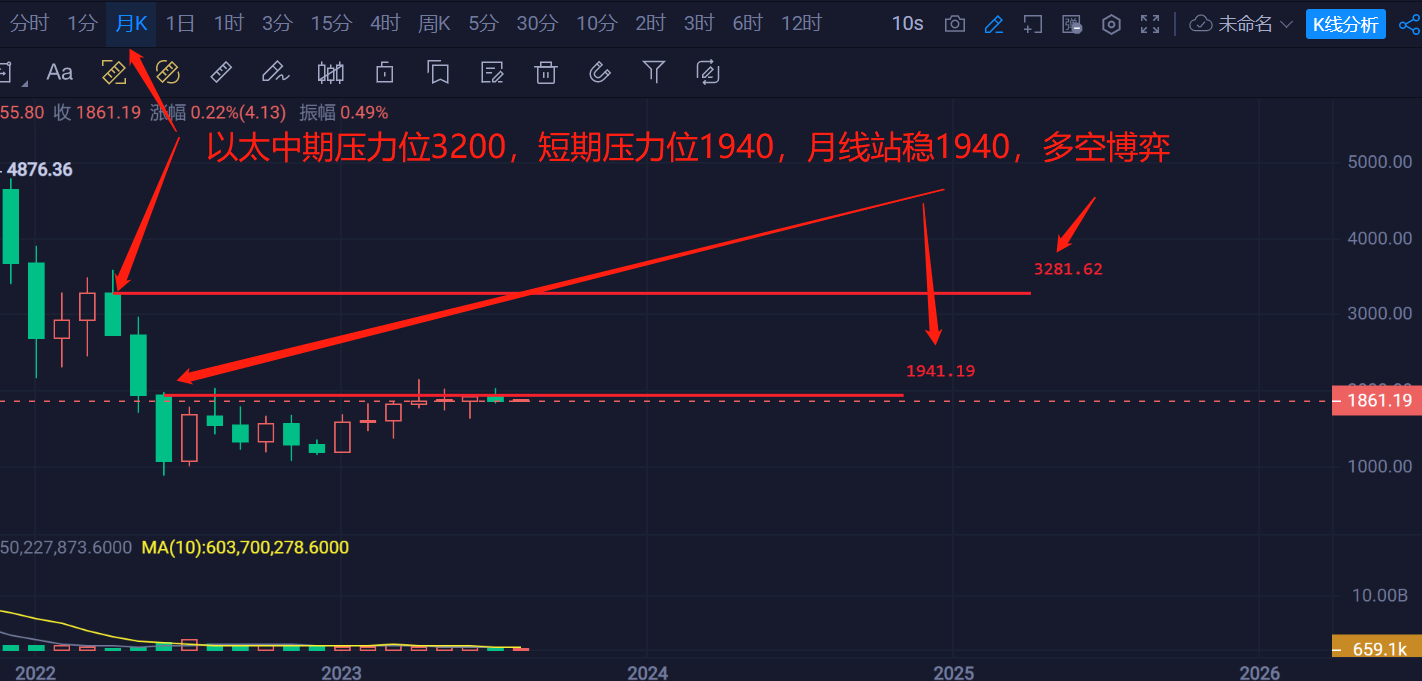
Ethereum has a similar candlestick pattern to Bitcoin, but the short-term pressure for Ethereum is at 1940, which will be an important battleground for bulls and bears in the monthly chart. From April to August, there have been multiple attempts to break through this pressure level, all of which have been in vain. 1940 has become a difficult gap for Ethereum to overcome in the short term. The basis for judging whether Ethereum can recover the bull market also lies in this position. If the monthly chart shows a strong breakthrough and easily crushes the 1940 pressure level, Ethereum can be said to truly enter a bull market. Otherwise, 1940 will become the high point for the bears!
Public Account QR Code: Specializing in the internal mechanisms of the market, judging trends through supply and demand relationships, and selecting the entry timing based on price and volume patterns!

免责声明:本文章仅代表作者个人观点,不代表本平台的立场和观点。本文章仅供信息分享,不构成对任何人的任何投资建议。用户与作者之间的任何争议,与本平台无关。如网页中刊载的文章或图片涉及侵权,请提供相关的权利证明和身份证明发送邮件到support@aicoin.com,本平台相关工作人员将会进行核查。


