5月14日晚上,AICoin 研究员在【AICoin PC端-群聊-直播】进行【5分钟BOLL高频战法(送会员)】的图文直播分享,以下是直播内容汇总。
一、算法分享
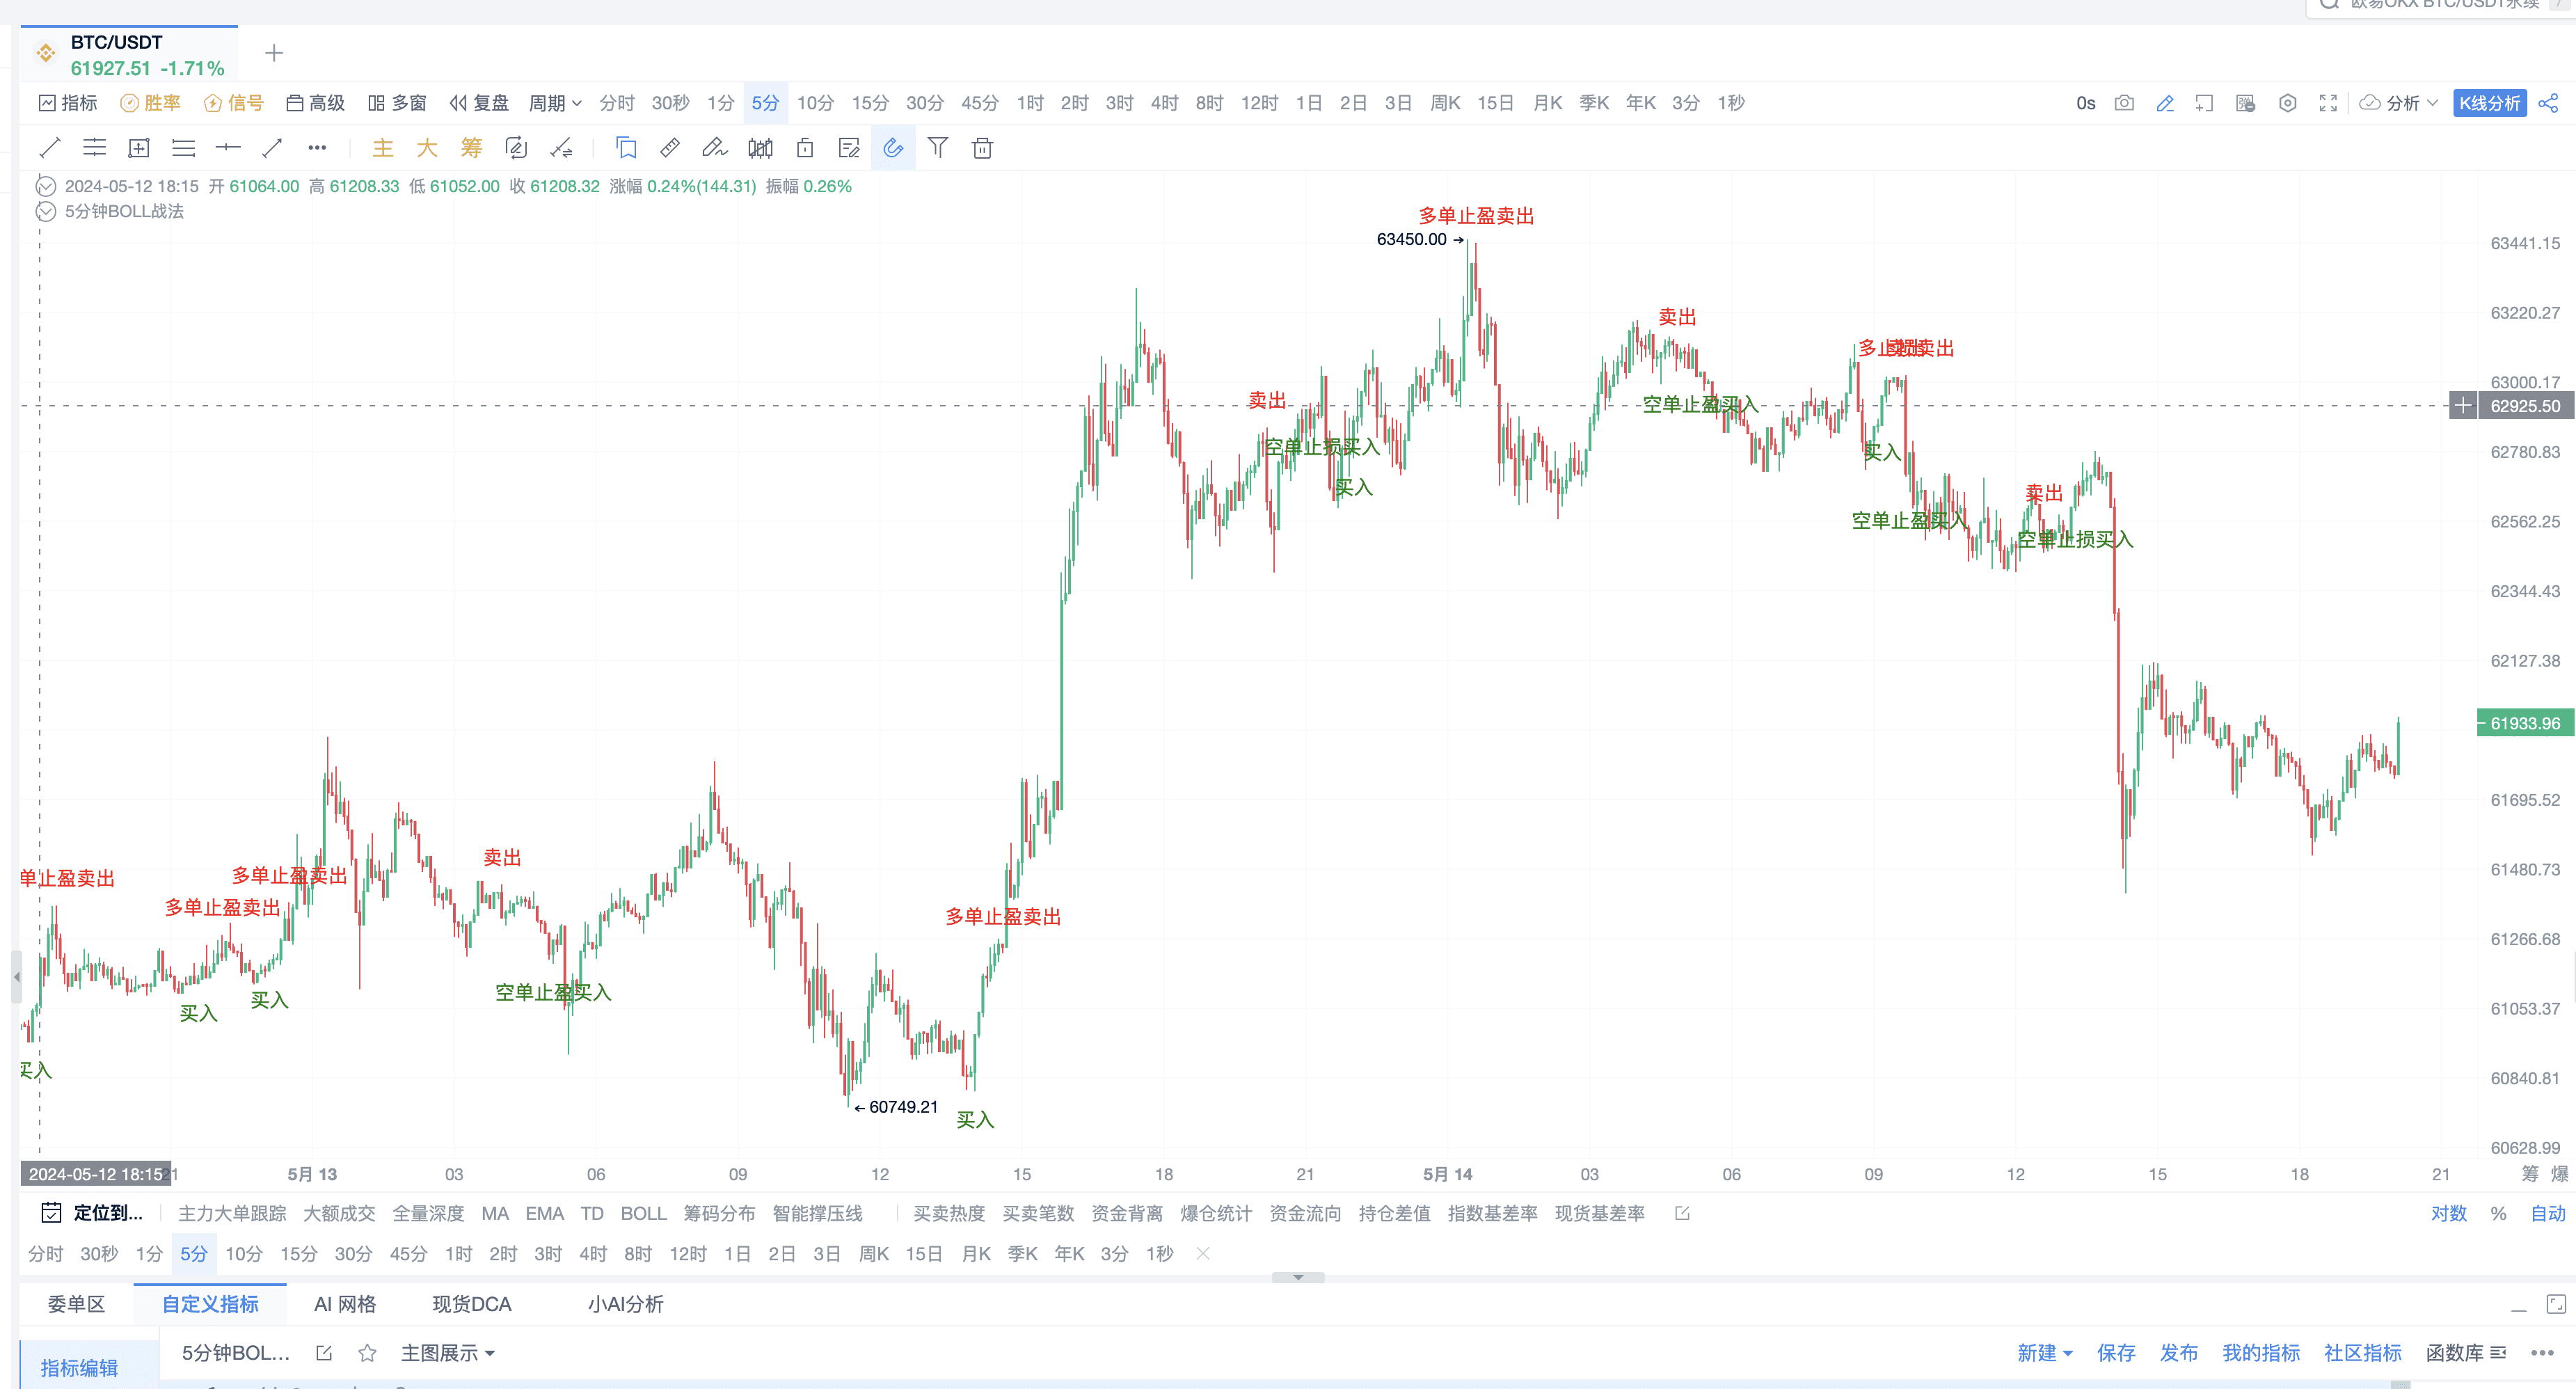
这套算法,运用了两个元素:
第一元素:5分钟周期,可以认为是相对适度的中短线,相对高频;
第二元素:这套策略的包含元素有:BOLL、KDJ指标,这两个指标,兼顾趋势和震荡,是比较适合玩转5分钟的。
二、概念讲解
1.BOLL指标
BOLL主要包含三个元素:上轨、中轨、下轨。
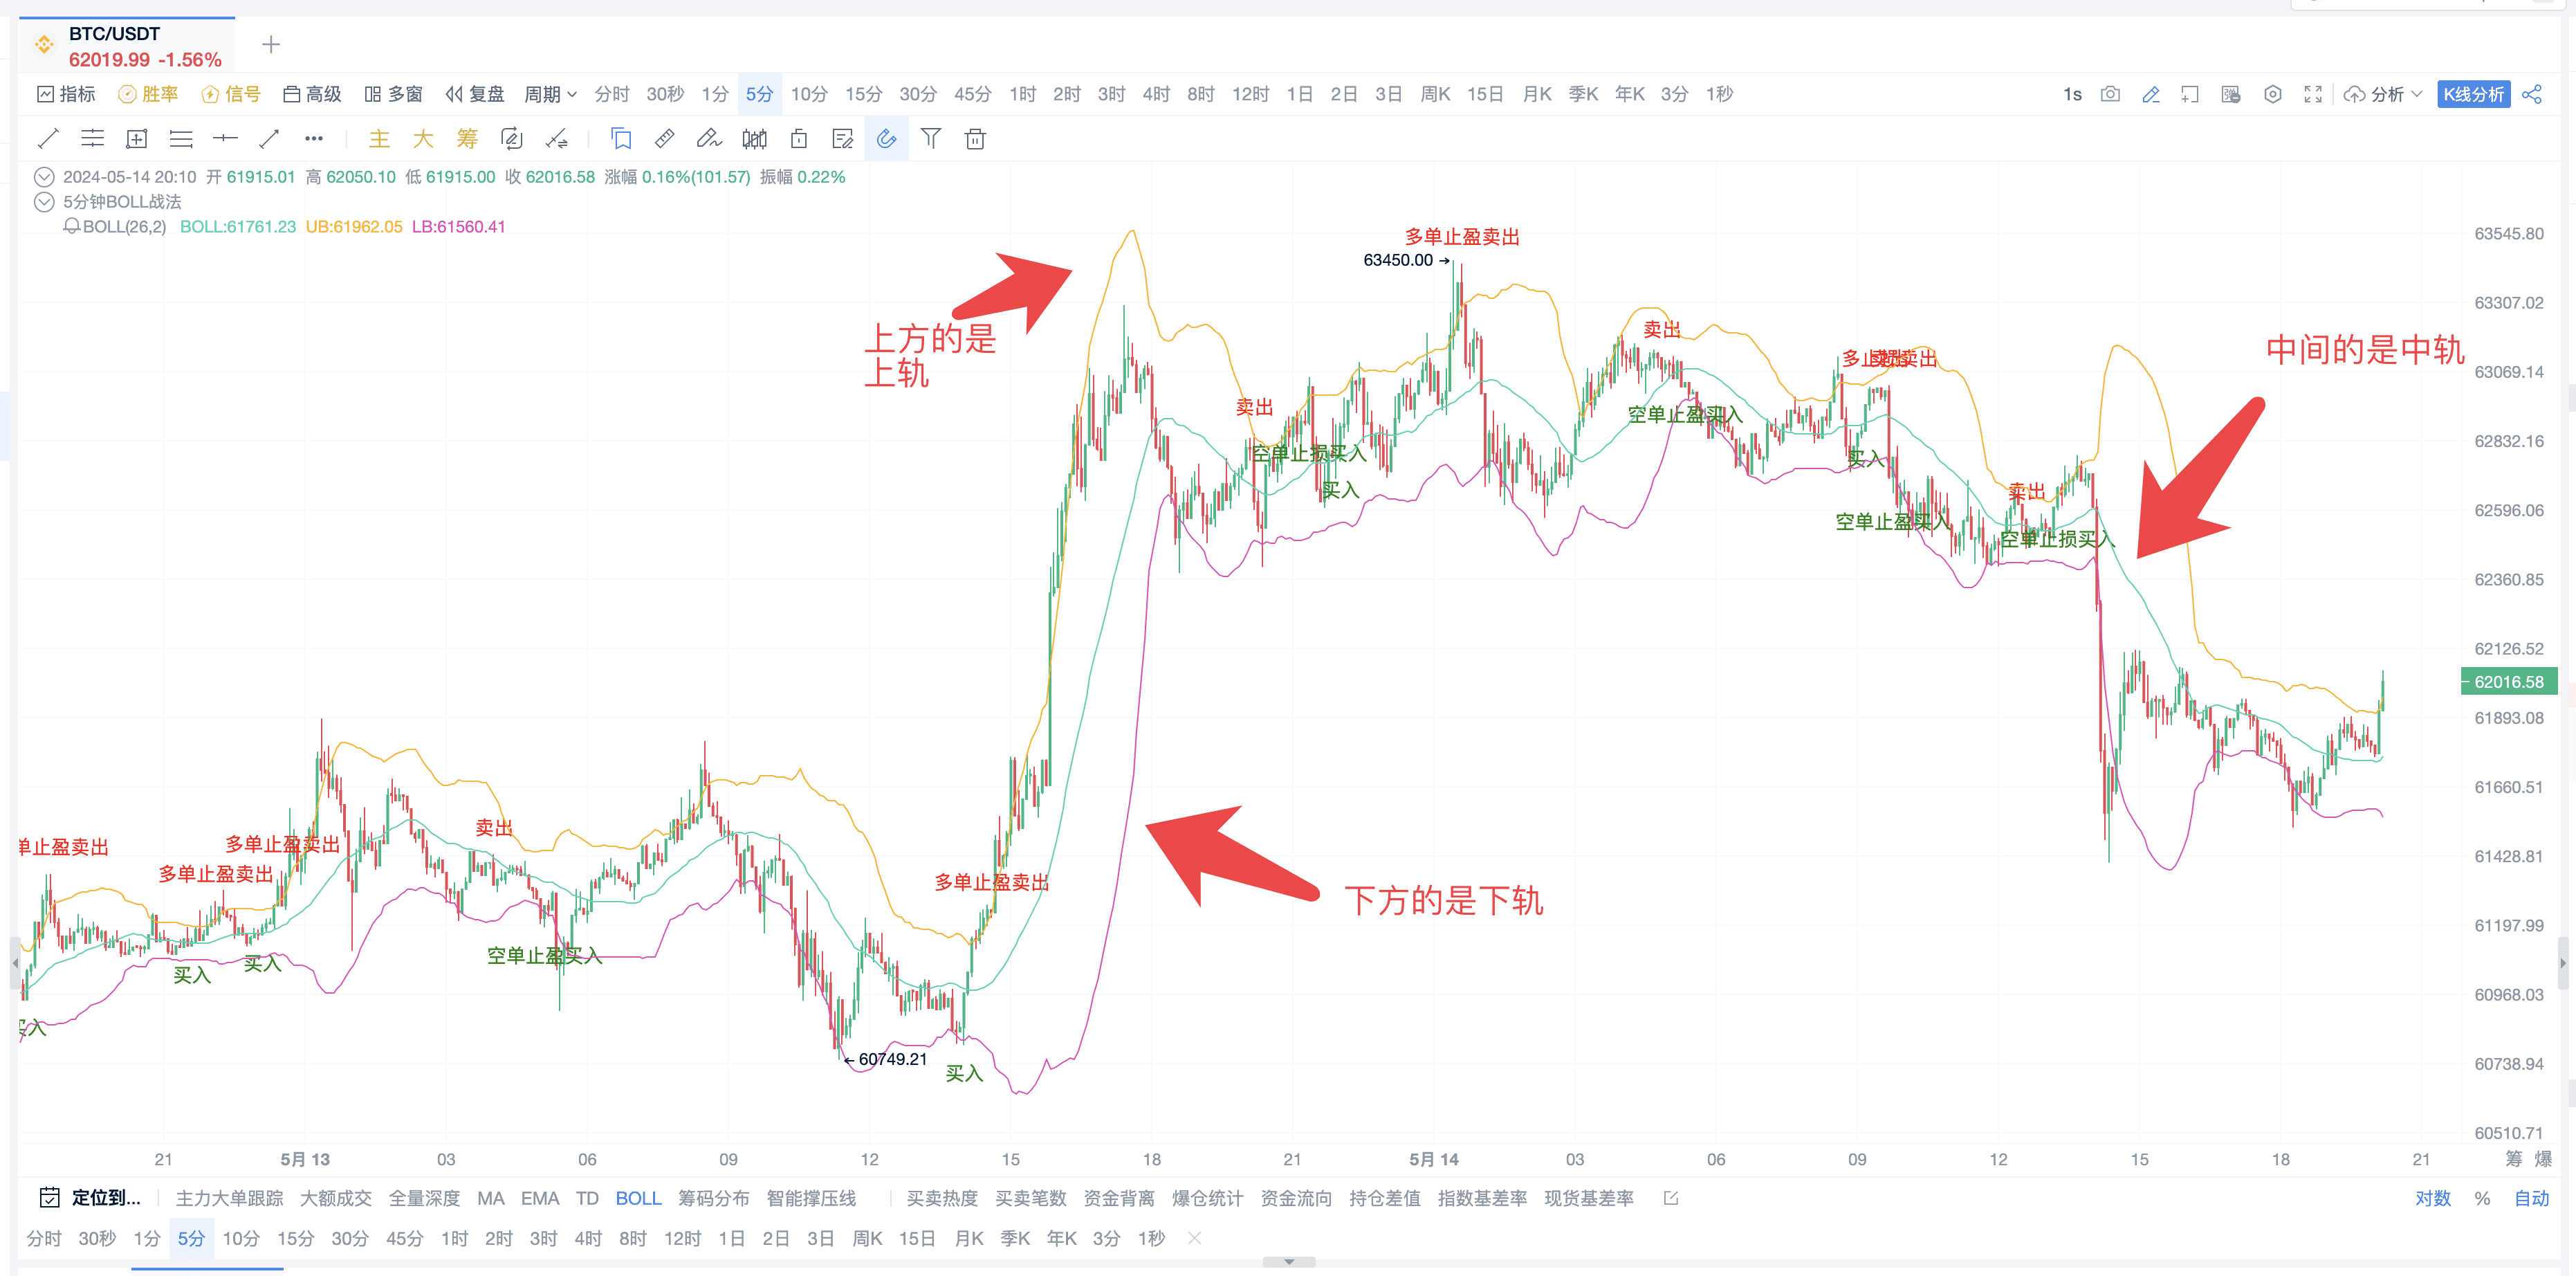
中轨是MA构成,所以会带着趋势;上下轨则拥有价格波动的判别。
(1)原理
上轨线和下轨线代表标准差,这意味着它们反映的是价格波动。当轨线收缩并且靠得很近时,表示市场将迎来低迷期。相反,当波段之间的距离扩大时,市场波动加强,价格行为增多。
(2)BOLL (布林线)的作用:
①确定价格趋势(boll轨道运行方向)
②读取趋势强度 (价格超买超卖情况)
③定位最佳入市时间 (布林收窄和扩张)
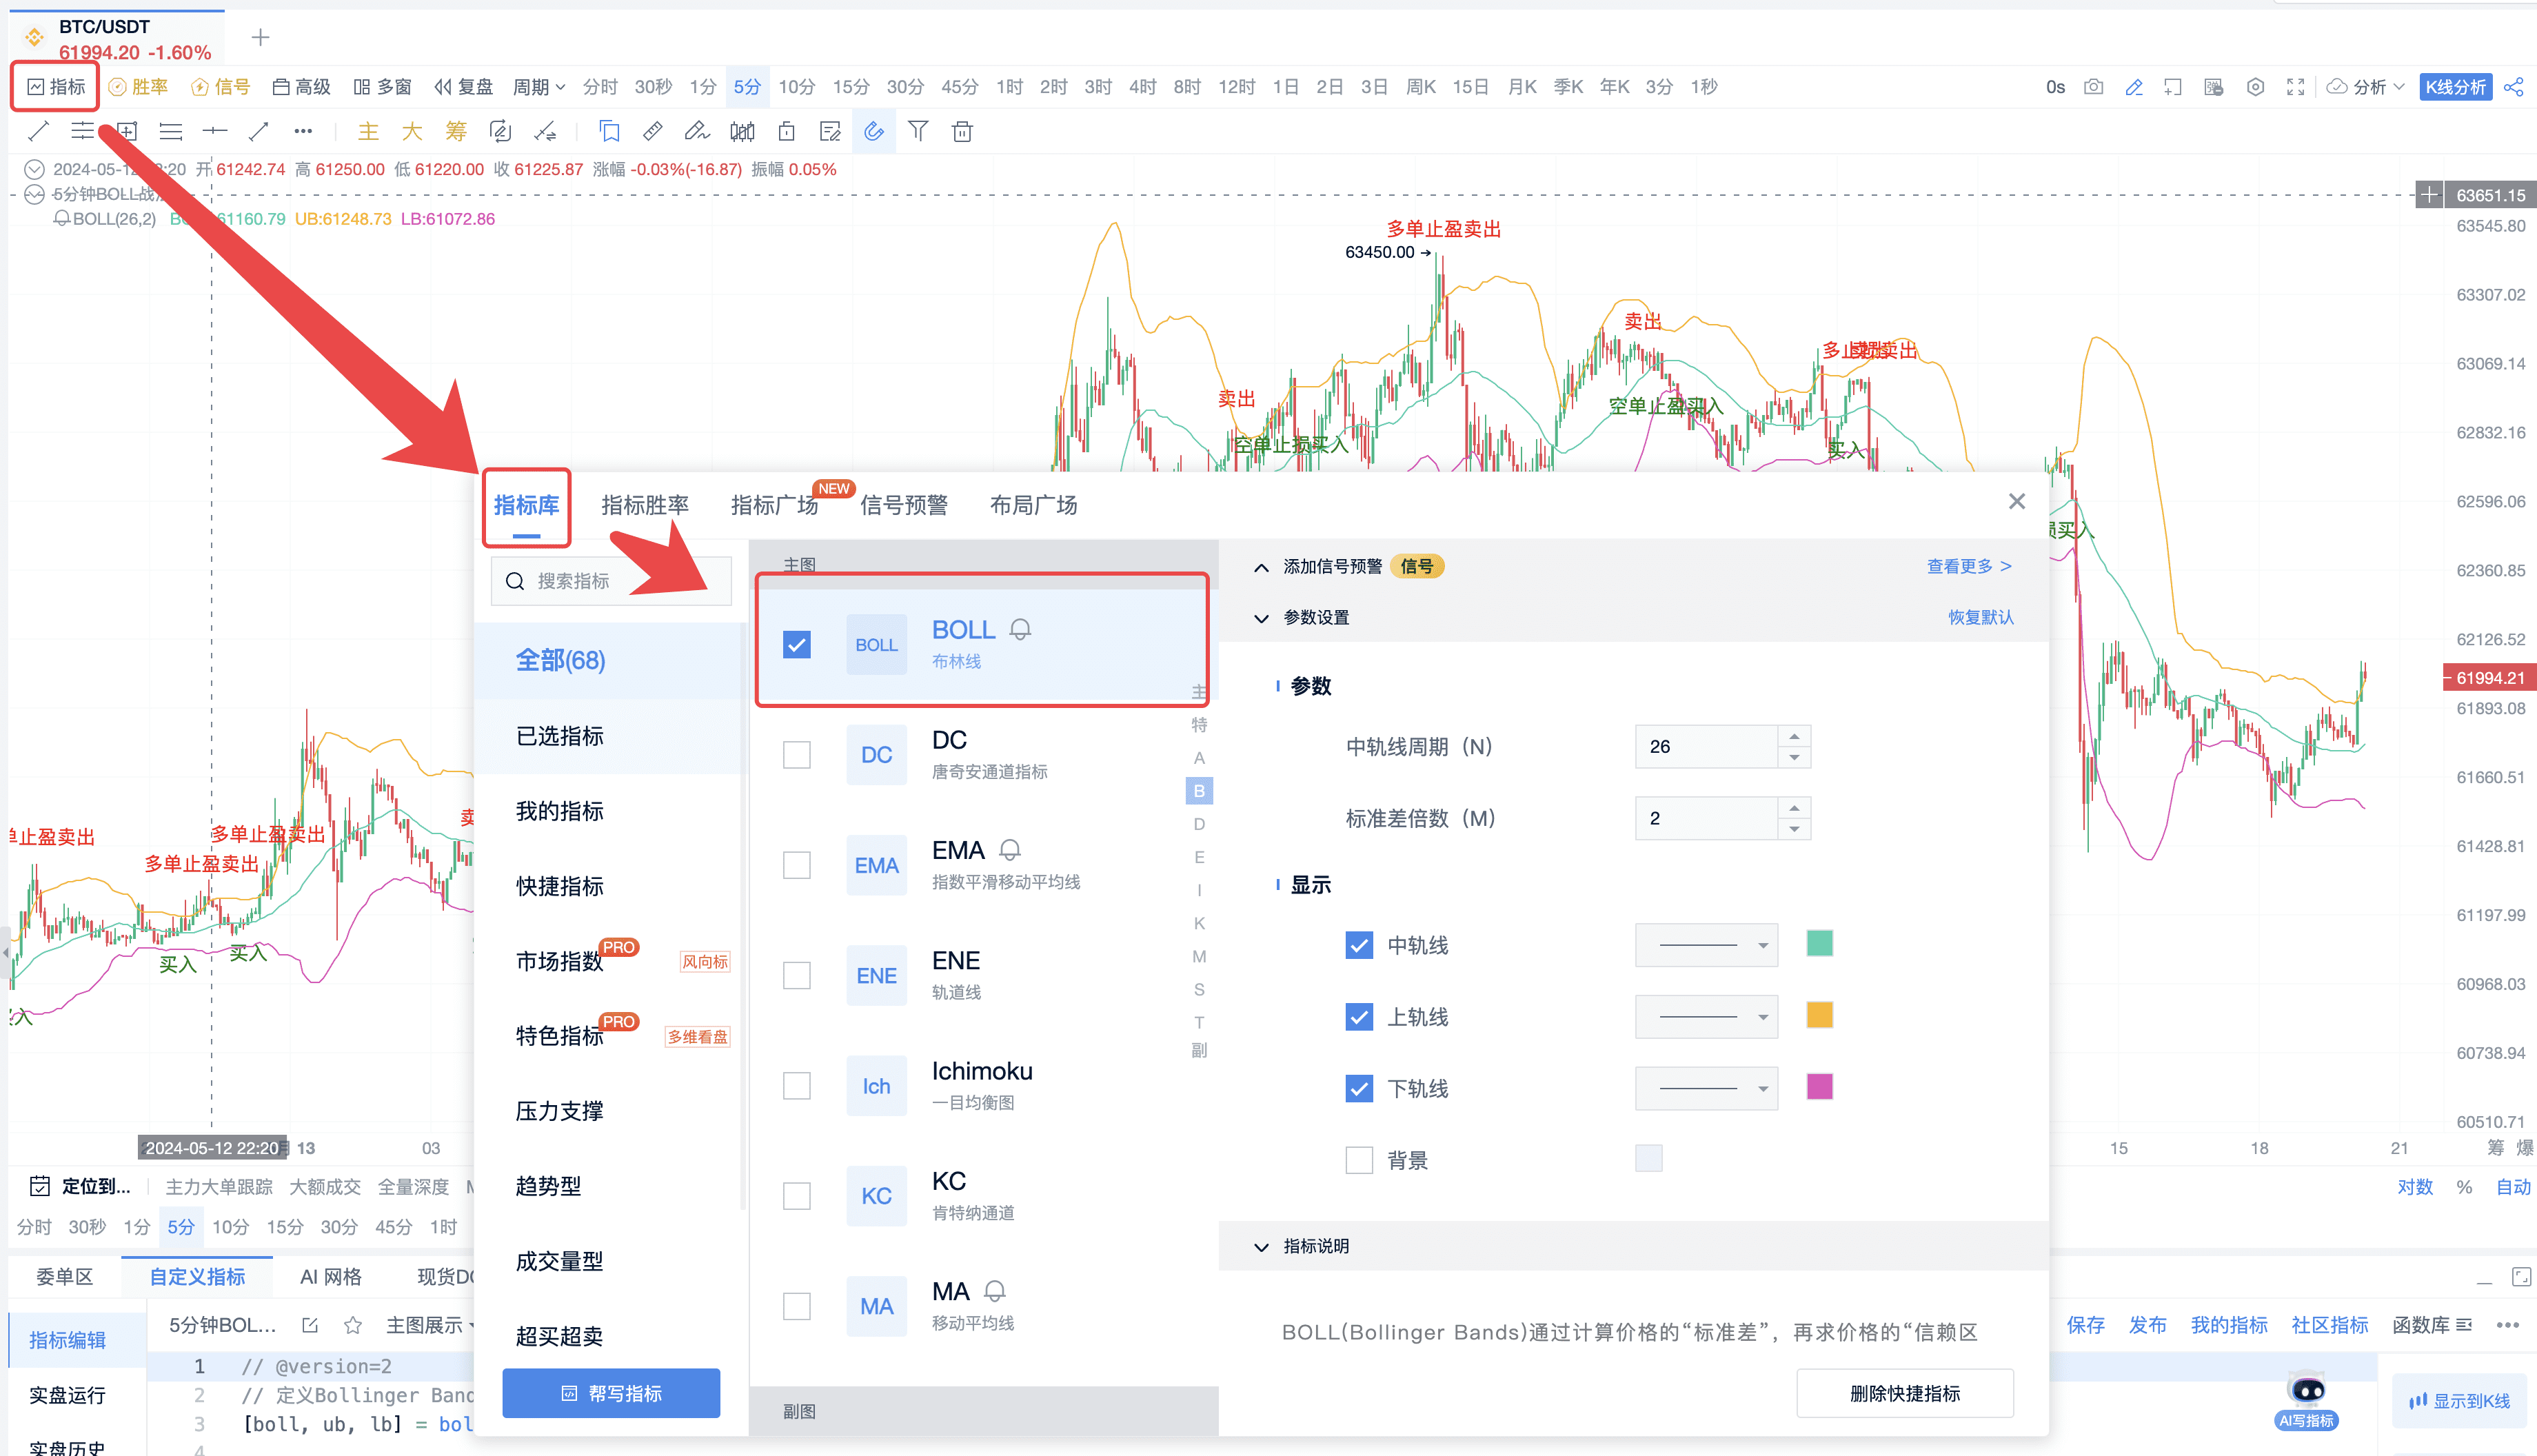
2、KDJ指标
KDJ同样,会有更多线。
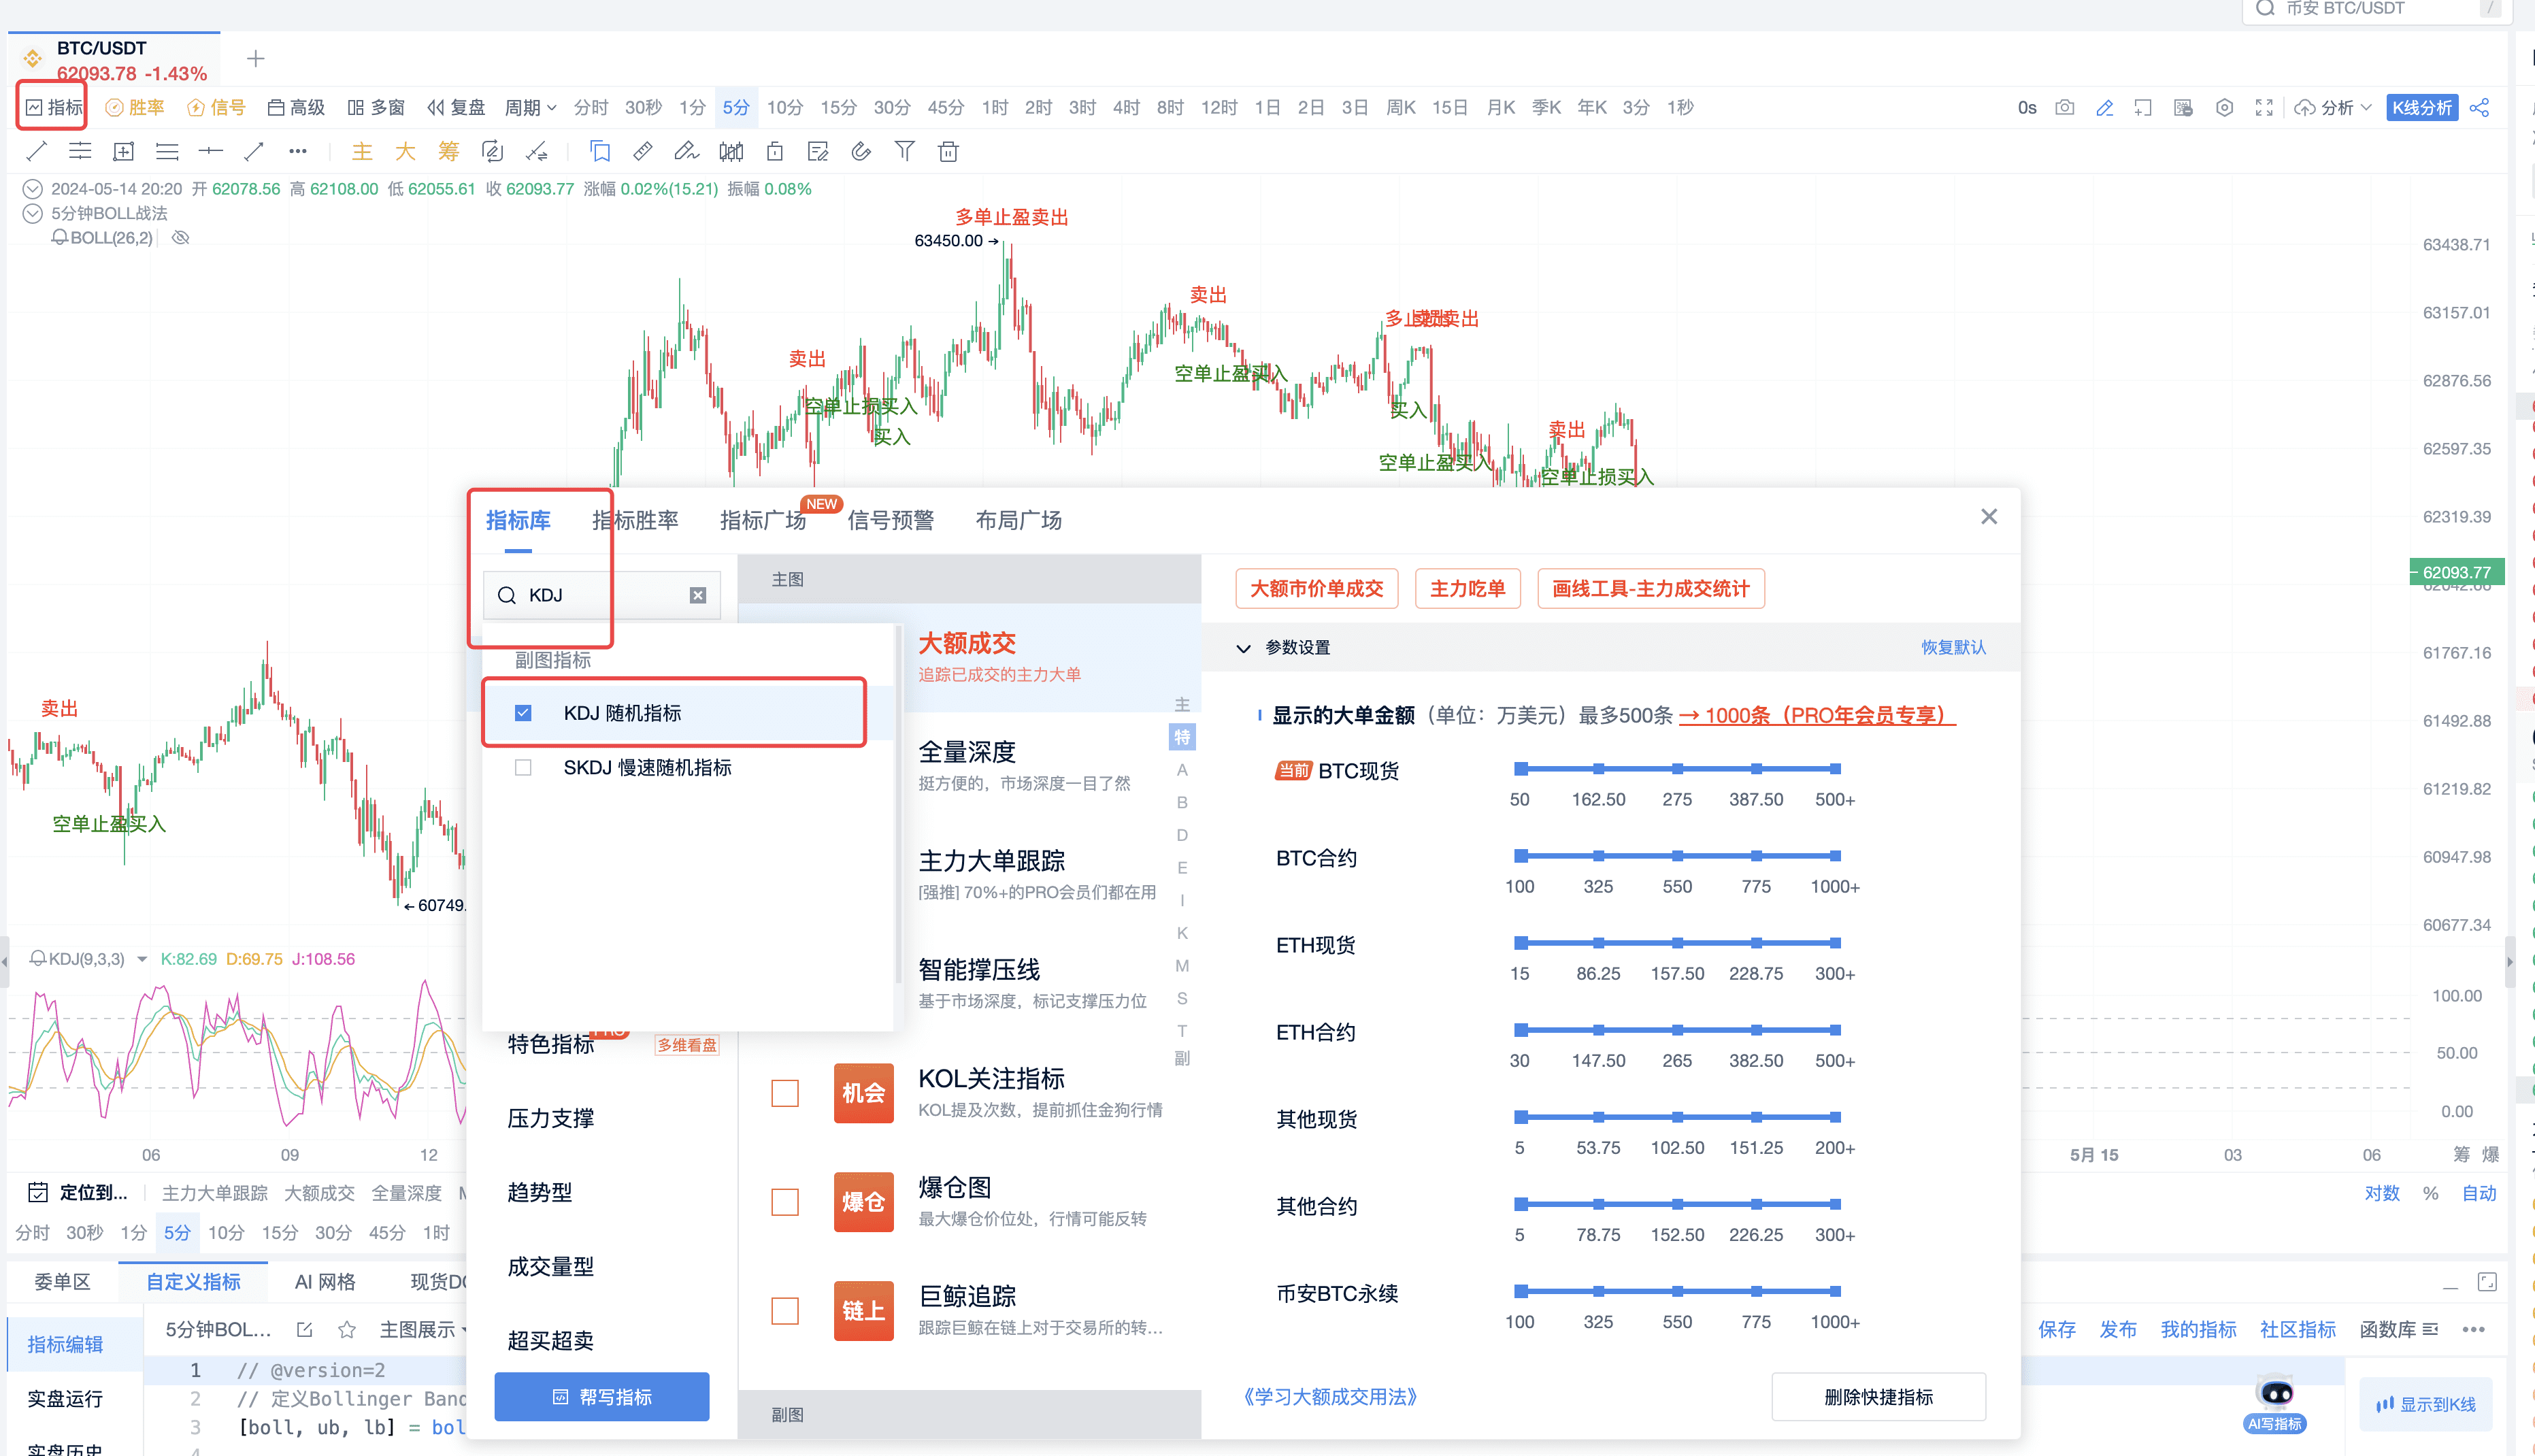
可以简单勾选起来看,特征:KDJ 由三条线组成,分别为 K 值线,D 值线,J 值线。其中,K值线又叫快速确认线。D值线又叫慢速主干线。J值线又叫方向敏感线。从名字来看其中的简单作用,J值线可作为判断趋势方向的参考线,K和D则可作为进场点位判断的参考线。
(1)原理
KDJ 是根据最高价格、最低价格和收盘价计算的。所以,它是利用价格波动的真实性来反映价格波动、超买和超卖的强度,并在价格上涨或下跌之前给出交易信号。
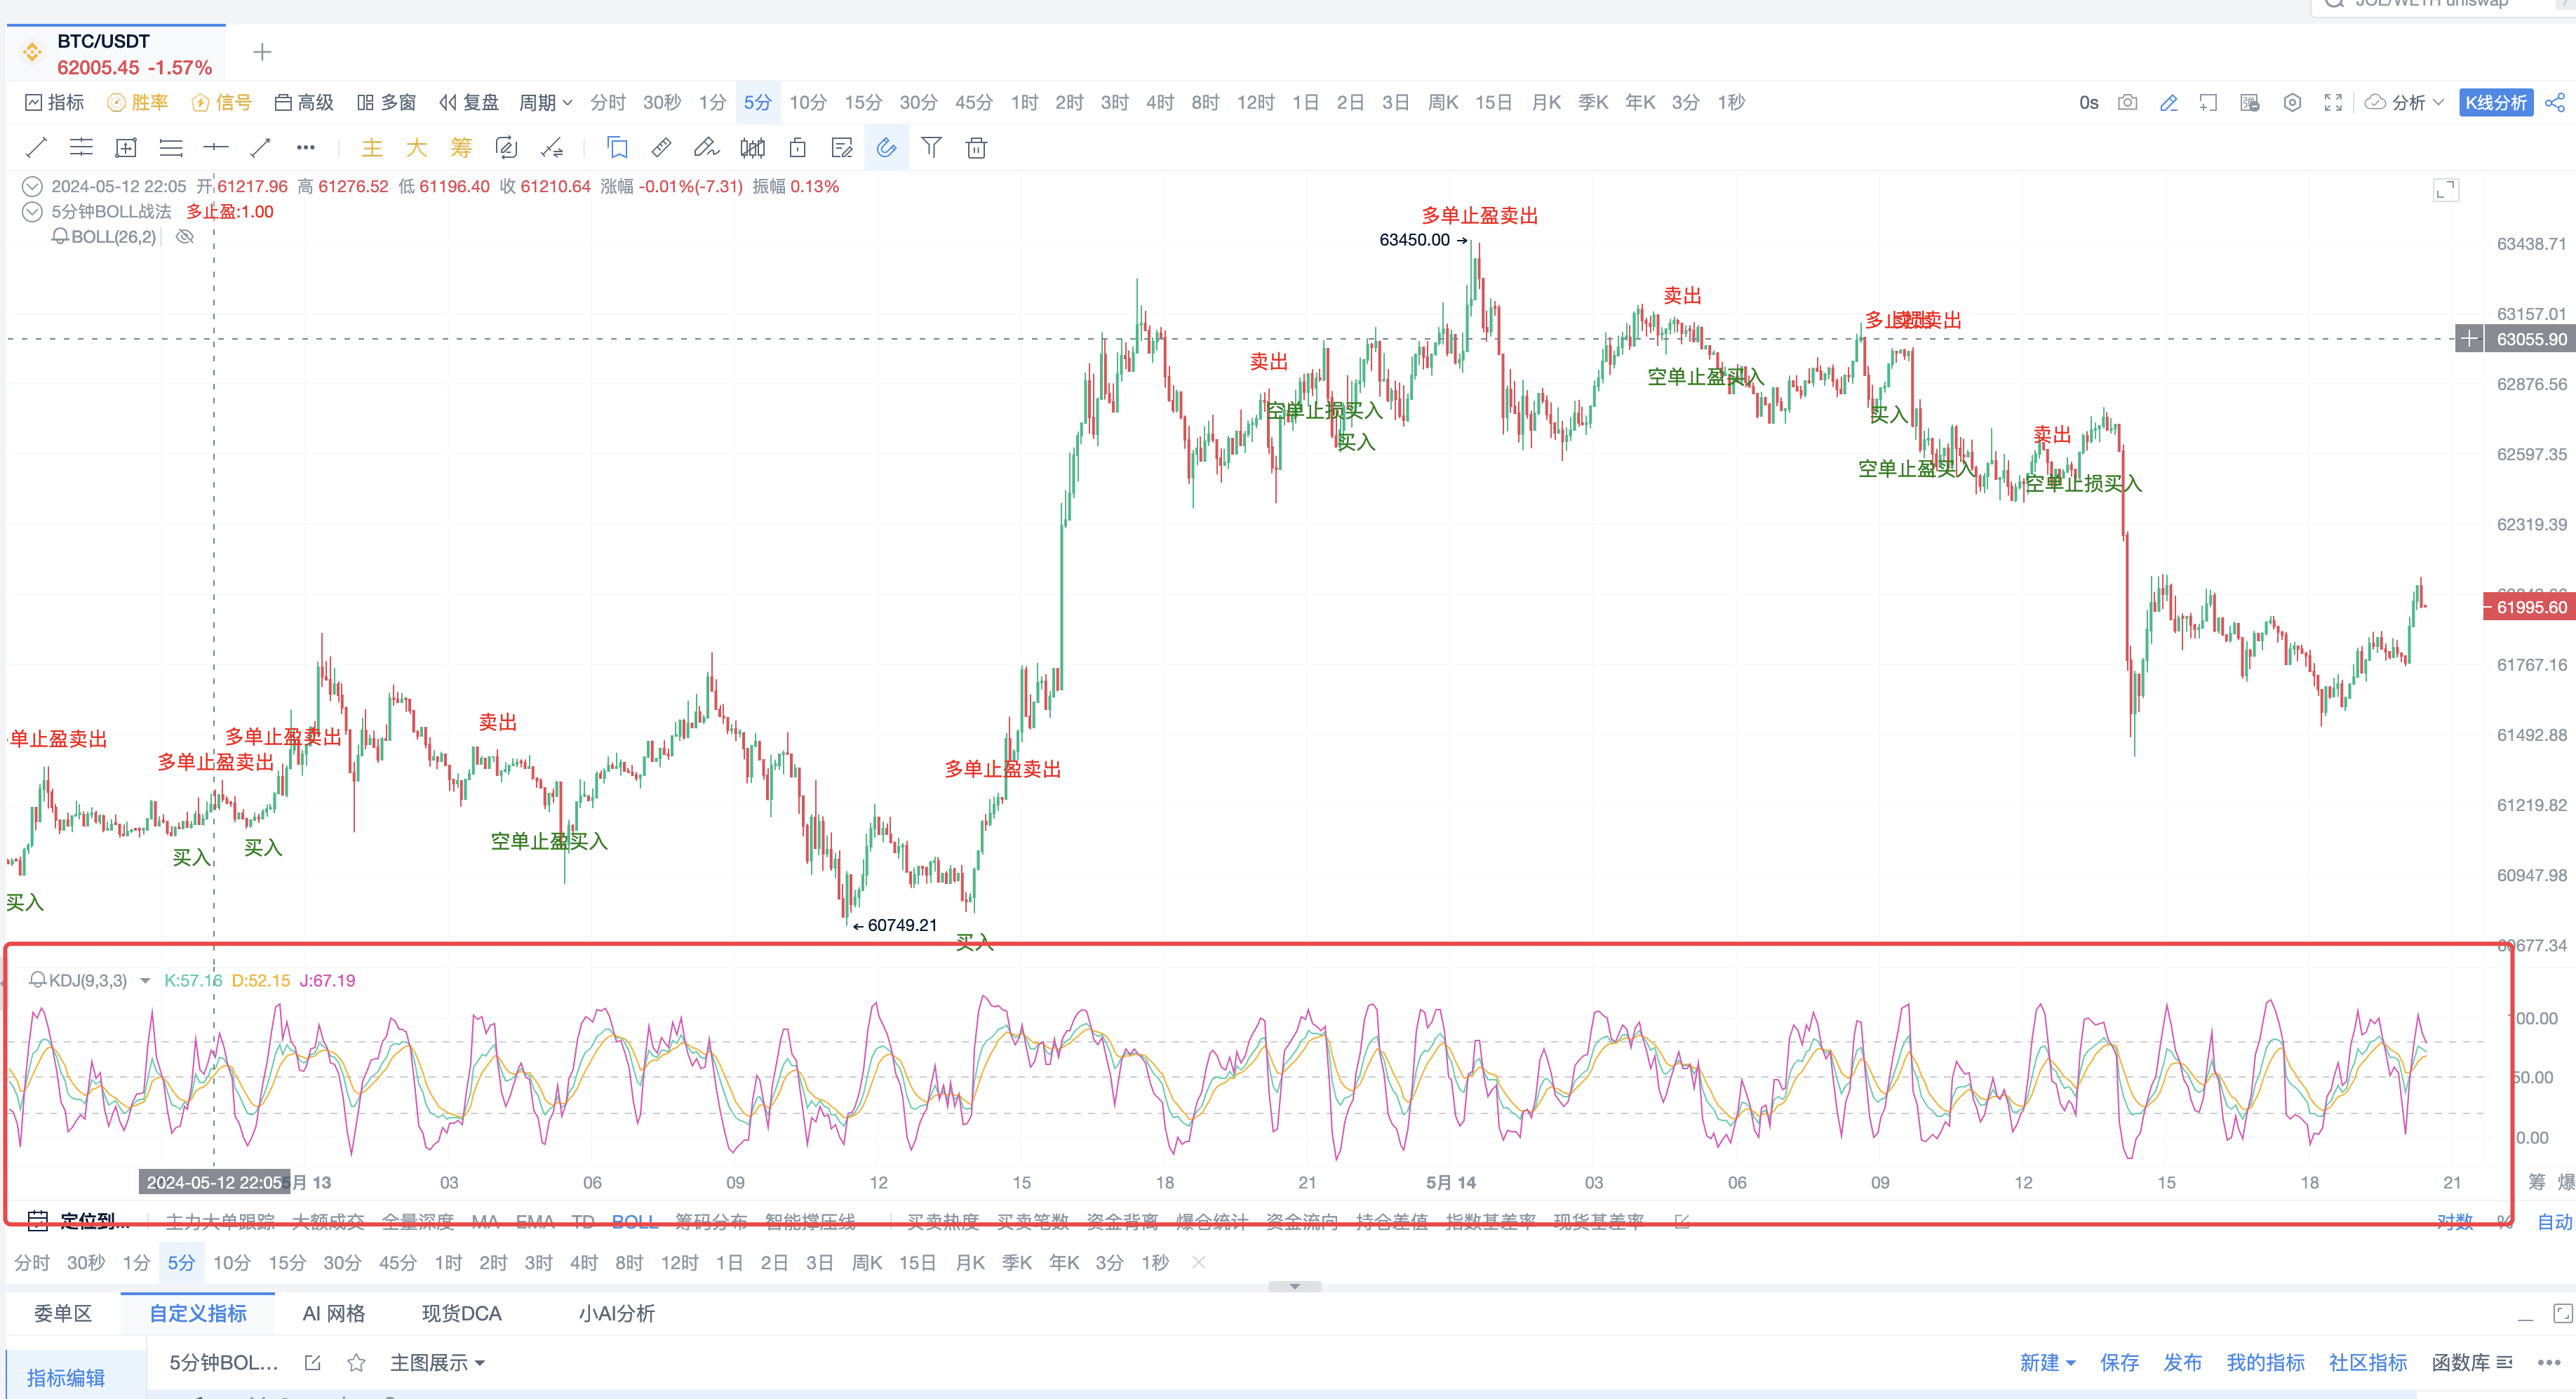
(2)KDJ的作用
用来做趋势参考,以及进场点位的判断。
三、脚本拆解
1、5分钟周期的BOLL+KDJ战法参数设置
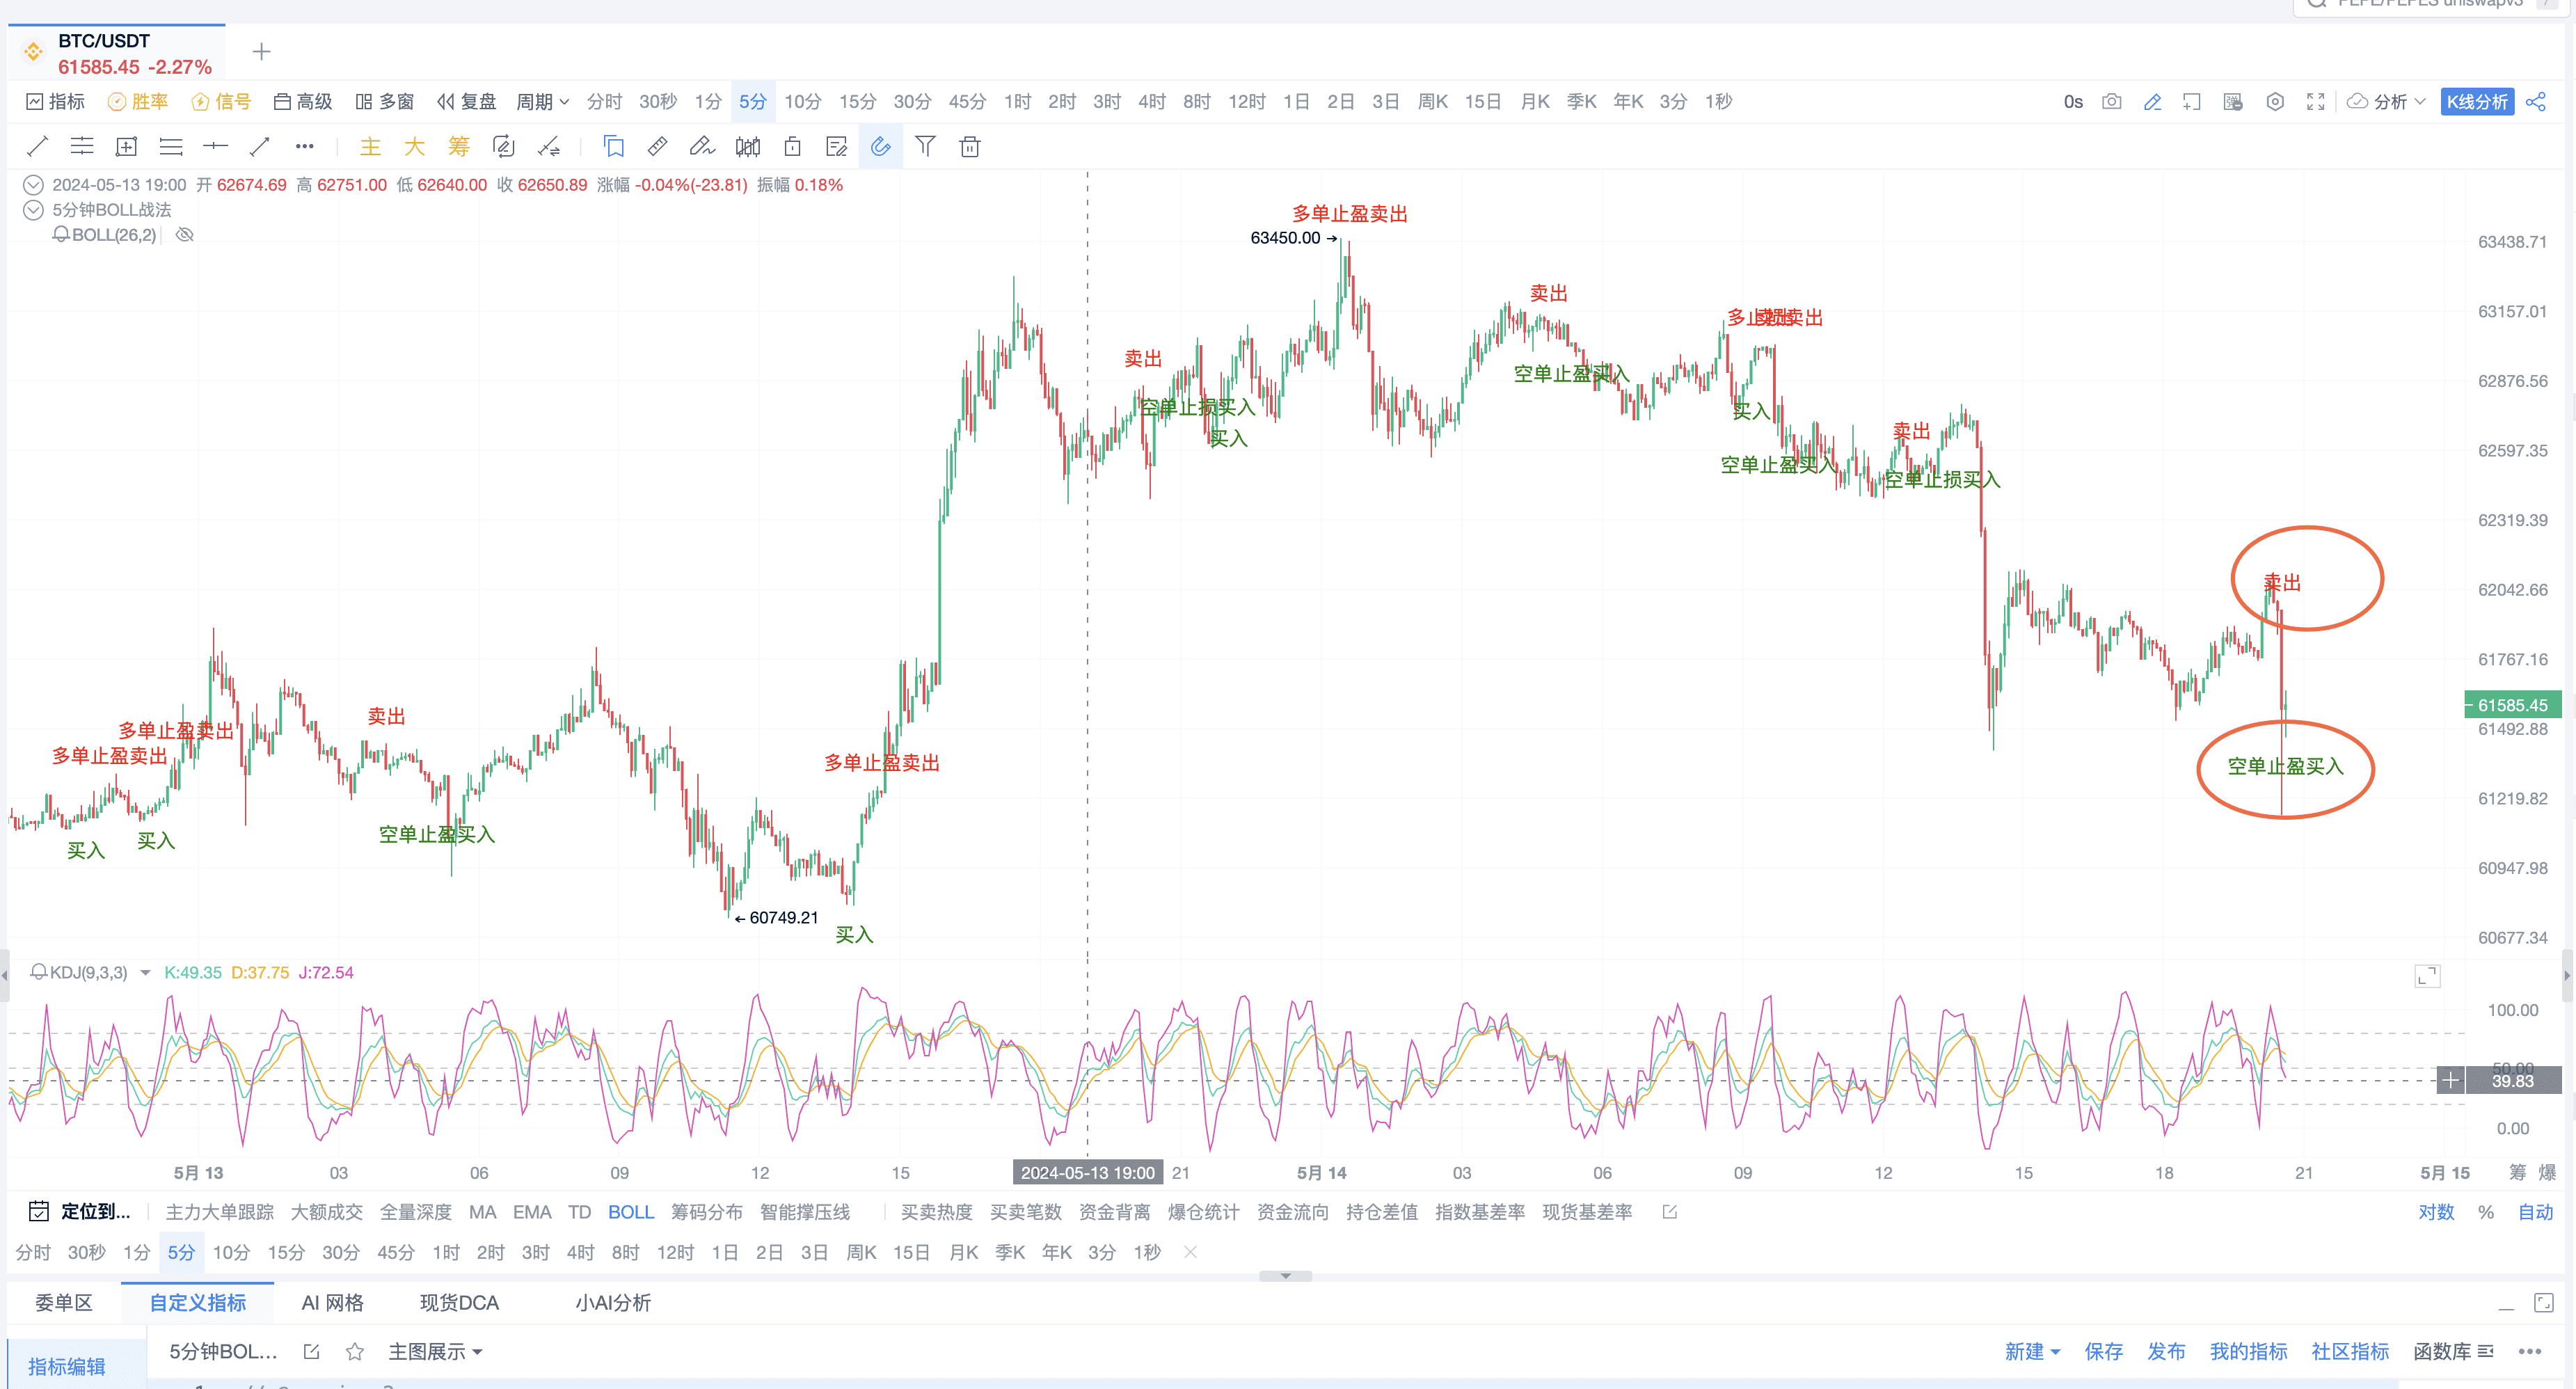
BOLL用的是20,2;KDJ用的是9,3,3。
这套策略的基本要素:
// 定义Bollinger Bands指标参数[boll, ub, lb] = boll(close, 20, 2);
// 定义KDJ指标参数[k, d, j] = kdj(close, 9, 3, 3, 'smma');
BOLL我们注意到重点是:价格穿越中轨的情况。KDJ我们注意的重点是:K和D之间互相穿越的情况。
所以,会得到这两个情况计算
// 计算Bollinger Bands中轨穿越情况
crossBollUp = crossup(close, boll);
crossBollDown = crossdown(close, boll);
// 计算KDJ金叉和死叉情况
kdjGoldenCross = crossup(k, d);
kdjDeadCross = crossdown(k, d);
构建完KDJ和boll的开仓情况之后,可以构建信号模型。
buySignal = kdjGoldenCross and crossBollUp and k < 50 and longCount == 0
sellSignal = crossBollDown and kdjDeadCross and k > 50 and shortCount == 0
if (buySignal) {
longCount := 1
}
if (sellSignal) {
shortCount := 1
}
这段模型提到的组合上面的KD金叉死叉以及BOLL的穿越情况。
2、构建止盈止损的信号
做完开仓之后,我们构建止盈止损的信号。
止盈止损的设置,我们可以使用穿越布林线的上下轨。计算多头止盈条件:K线上穿布林带上轨后回落至布林带范围内。这里吃的类似一个移动止盈的模式。就是如果涨破上轨回来,可能会走个回归,说明上涨短期到头了。适合止盈。那么止损,同理,用到的是布林线的下轨。
整体的代码:
// 计算多头止盈条件:K线上穿布林带上轨后回落至布林带范围内
cross_up_ub = crossdown(close, ub)
long_take_profit = cross_up_ub and close < ub and close > lb and longCount == 1
if (long_take_profit) {
longCount := 0
}
// 计算多头止损条件:跌破布林带下轨
long_stop_loss = crossdown(close, lb) and longCount == 1
if (long_stop_loss) {
longCount := 0
}
cross_down_lb = crossup(close, lb)
short_take_profit = cross_down_lb and close > lb and close < ub and shortCount == 1
if (short_take_profit) {
shortCount := 0
}
short_stop_loss = crossup(close, ub) and shortCount == 1
if (short_stop_loss) {
shortCount := 0
}
到这里,其实已经构建完成了,开平仓条件,止盈止损条件,一套完整策略呼之欲出了。
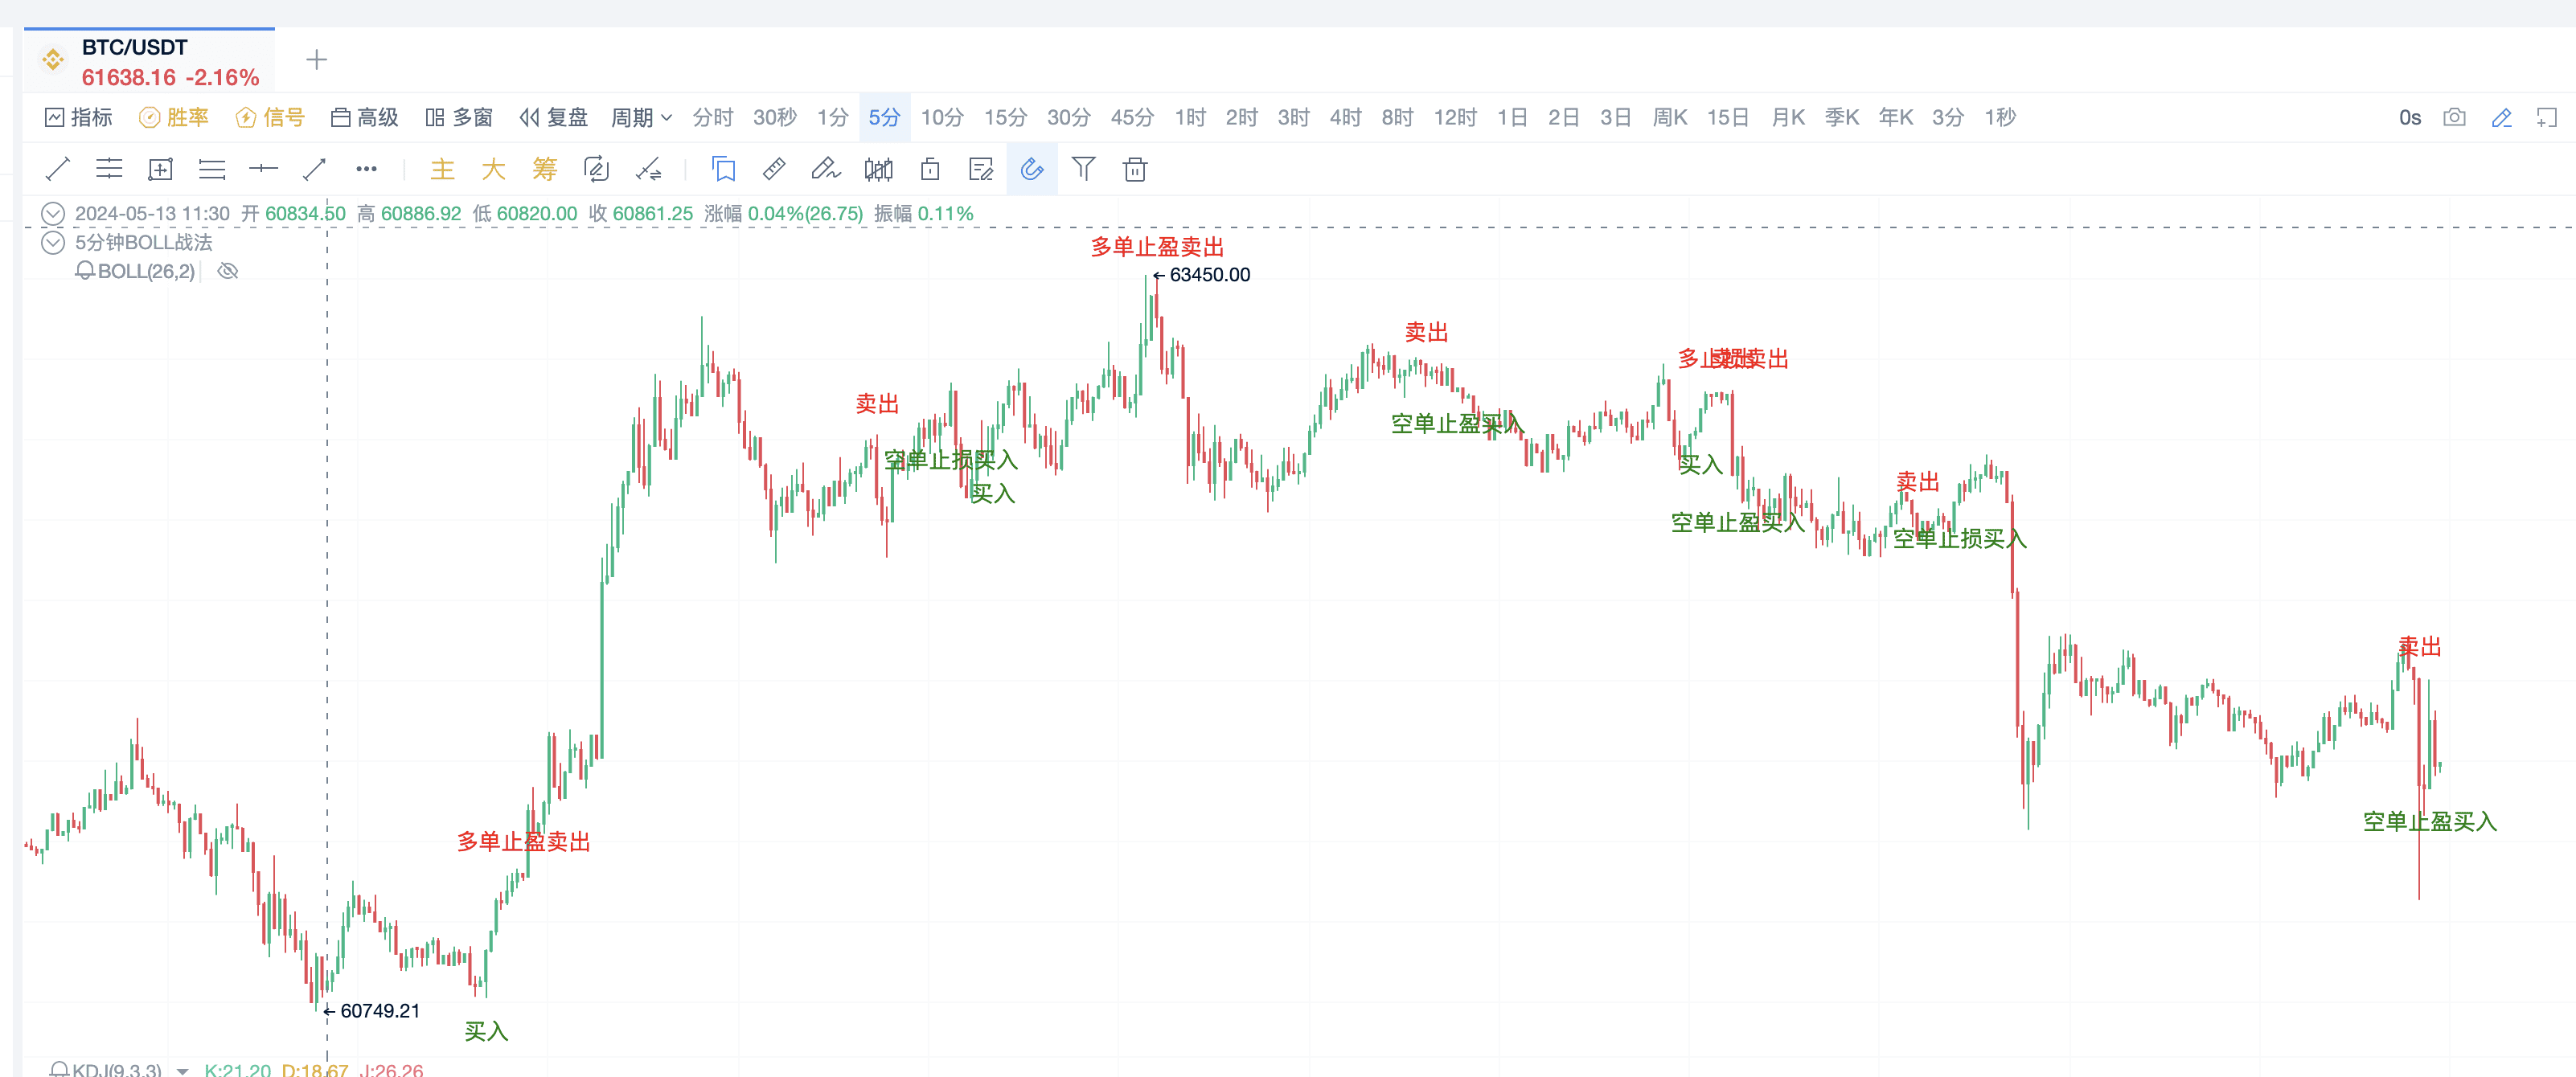
3、在K线上展示
接下来需要构建的是,放到k线上展示。加上预警功能,可以随时随地的提醒你去做交易。加上自动交易功能,可以7x24小时躺平交易。
第一步,我们构建好展示到k线的代码
// 绘制穿越中轨和金叉死叉信号到图表
plotText(buySignal, title="穿越中轨向上+KDJ金叉", text='买入', color='green', refSeries=low, placement='bottom');
plotText(sellSignal, title="穿越中轨向下+KDJ死叉", text='卖出', color='red', refSeries=high, placement='top');
plotText(short_take_profit, title="空止盈", text='空单止盈买入', color='green', refSeries=low, placement='bottom');
plotText(short_stop_loss, title="空止损", text='空单止损买入', color='green', refSeries=low, placement='bottom');
plotText(long_take_profit, title="多止盈", text='多单止盈卖出', color='red', refSeries=high, placement='top');
plotText(long_stop_loss, title="多止损", text='多止损卖出', color='red', refSeries=high, placement='top');
第二步,设置预警条件
// 设置预警条件
alertcondition(buySignal, title="穿越中轨向上+KDJ金叉", direction="buy");
alertcondition(sellSignal, title="穿越中轨向下+KDJ死叉", direction="sell");
alertcondition(short_take_profit, title="空止盈", direction="buy");
alertcondition(short_stop_loss, title="空止损", direction="buy");
alertcondition(long_take_profit, title="多止盈", direction="sell");
alertcondition(long_stop_loss, title="多止损", direction="sell");
最后,加上这段代码!
exitLong(long_take_profit or long_stop_loss, price='market', amount=1)
exitShort(short_take_profit or short_stop_loss, price='market', amount=1)
enterLong(buySignal, price='market', amount=1)
enterShort(sellSignal, price='market', amount=1)
点击实盘交易
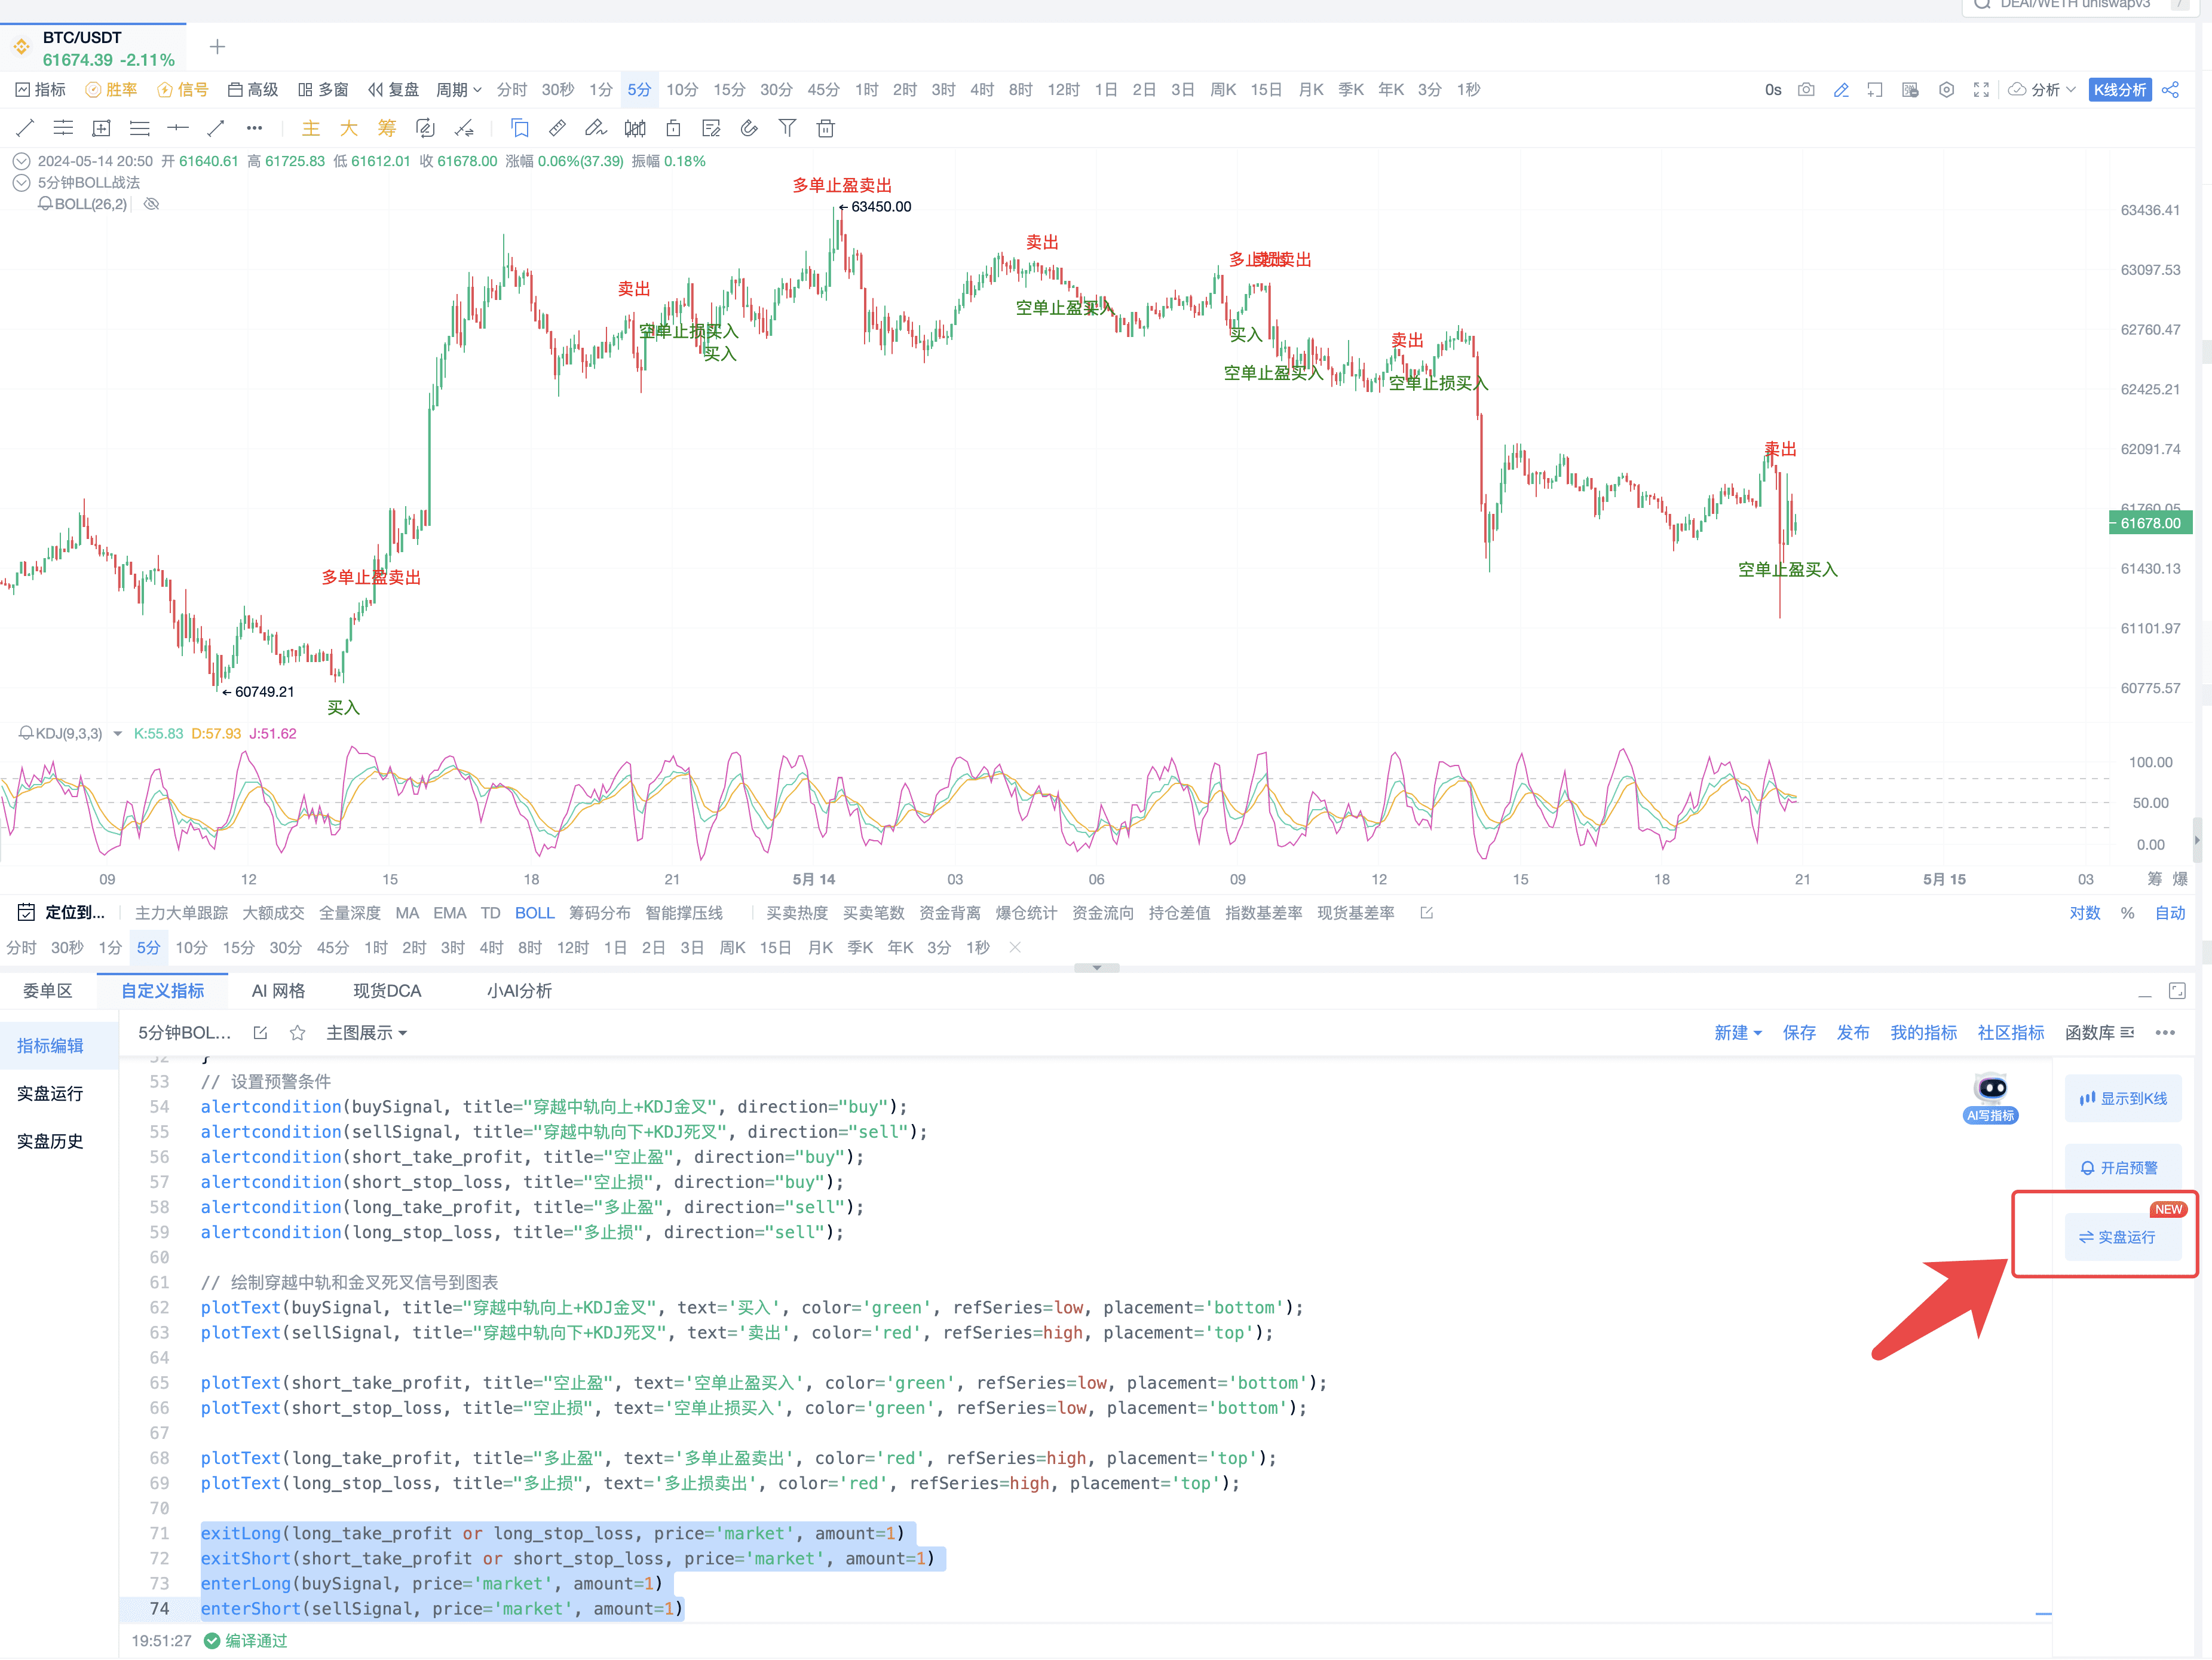
就可以直接在pc软件客户端上面交易,平时自己只需要做的是,研究策略,复盘信号,修正策略模型。把交易操作的时间,这些琐碎的工作,交给软件,自己做有意义的事。
4、完整代码
// @version=2
// 定义Bollinger Bands指标参数
[boll, ub, lb] = boll(close, 20, 2);
// 定义KDJ指标参数
[k, d, j] = kdj(close, 9, 3, 3, 'smma');
var longCount = 0;
var shortCount = 0;
// 计算Bollinger Bands中轨穿越情况
crossBollUp = crossup(close, boll);
crossBollDown = crossdown(close, boll);
// 计算KDJ金叉和死叉情况
kdjGoldenCross = crossup(k, d);
kdjDeadCross = crossdown(k, d);
buySignal = kdjGoldenCross and crossBollUp and k < 50 and longCount == 0
sellSignal = crossBollDown and kdjDeadCross and k > 50 and shortCount == 0
if (buySignal) {
longCount := 1
}
if (sellSignal) {
shortCount := 1
}
// 计算多头止盈条件:K线上穿布林带上轨后回落至布林带范围内
cross_up_ub = crossdown(close, ub)
long_take_profit = cross_up_ub and close < ub and close > lb and longCount == 1
if (long_take_profit) {
longCount := 0
}
// 计算多头止损条件:跌破布林带下轨
long_stop_loss = crossdown(close, lb) and longCount == 1
if (long_stop_loss) {
longCount := 0
}
cross_down_lb = crossup(close, lb)
short_take_profit = cross_down_lb and close > lb and close < ub and shortCount == 1
if (short_take_profit) {
shortCount := 0
}
short_stop_loss = crossup(close, ub) and shortCount == 1
if (short_stop_loss) {
shortCount := 0
}
// 设置预警条件
alertcondition(buySignal, title="穿越中轨向上+KDJ金叉", direction="buy");
alertcondition(sellSignal, title="穿越中轨向下+KDJ死叉", direction="sell");
alertcondition(short_take_profit, title="空止盈", direction="buy");
alertcondition(short_stop_loss, title="空止损", direction="buy");
alertcondition(long_take_profit, title="多止盈", direction="sell");
alertcondition(long_stop_loss, title="多止损", direction="sell");
// 绘制穿越中轨和金叉死叉信号到图表
plotText(buySignal, title="穿越中轨向上+KDJ金叉", text='买入', color='green', refSeries=low, placement='bottom');
plotText(sellSignal, title="穿越中轨向下+KDJ死叉", text='卖出', color='red', refSeries=high, placement='top');
plotText(short_take_profit, title="空止盈", text='空单止盈买入', color='green', refSeries=low, placement='bottom');
plotText(short_stop_loss, title="空止损", text='空单止损买入', color='green', refSeries=low, placement='bottom');
plotText(long_take_profit, title="多止盈", text='多单止盈卖出', color='red', refSeries=high, placement='top');
plotText(long_stop_loss, title="多止损", text='多止损卖出', color='red', refSeries=high, placement='top');
exitLong(long_take_profit or long_stop_loss, price='market', amount=1)
exitShort(short_take_profit or short_stop_loss, price='market', amount=1)
enterLong(buySignal, price='market', amount=1)
enterShort(sellSignal, price='market', amount=1)
PRO会员、信号预警会员,就是为懒人朋友专属定制的优质工具,自定义指标是可以帮任何AICoin 的用户朋友,计划他们的交易,交易他们的计划。想要更多的自定义指标策略展示以及多个预警提醒,欢迎开通信号预警/PRO版K线,都能限时免费体验自定义指标会员。点击下方链接开通体验:https://aicoin.com/zh-CN/vip/chartpro
推荐阅读
更多直播干货,请关注AICoin“新闻/资讯-直播回顾”栏目,欢迎下载AICoin PC端
免责声明:本文章仅代表作者个人观点,不代表本平台的立场和观点。本文章仅供信息分享,不构成对任何人的任何投资建议。用户与作者之间的任何争议,与本平台无关。如网页中刊载的文章或图片涉及侵权,请提供相关的权利证明和身份证明发送邮件到support@aicoin.com,本平台相关工作人员将会进行核查。


